

We talked about bullish GrayScale Bitcoin Investment Trust (GBTC) already back on February 28th with a weekly free chart, where we mentioned and highlighted an ongoing five-wave impulsive bullish cycle.
GBTC weekly chart rrom February 28 2024
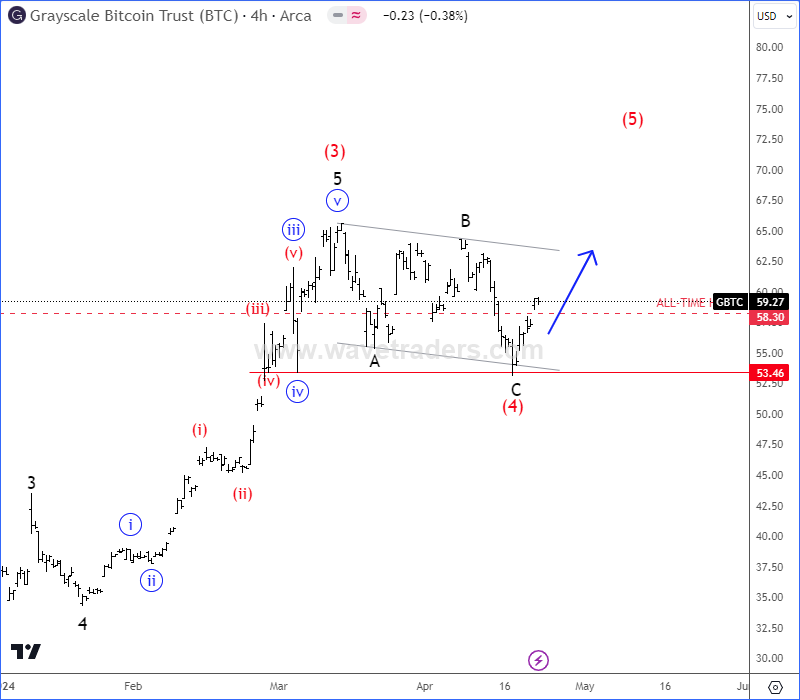
Well, as we actually expected, after GBTC reached all-time highs, we can see a projected slow down that looks like a wave (4) correction.
A correction actually occurred a month before the Bitcoin halving and finished right before the Bitcoin halving. And, as you can see now in a closer, 4-hour chart after the halving, GBTC is bouncing from projected support after a completed A-B-C correction in wave (4), so wave (5) is now in progress, which can easily lift Bitcoin price back to highs as well.
GBTC four-hour chart from April 23 2024
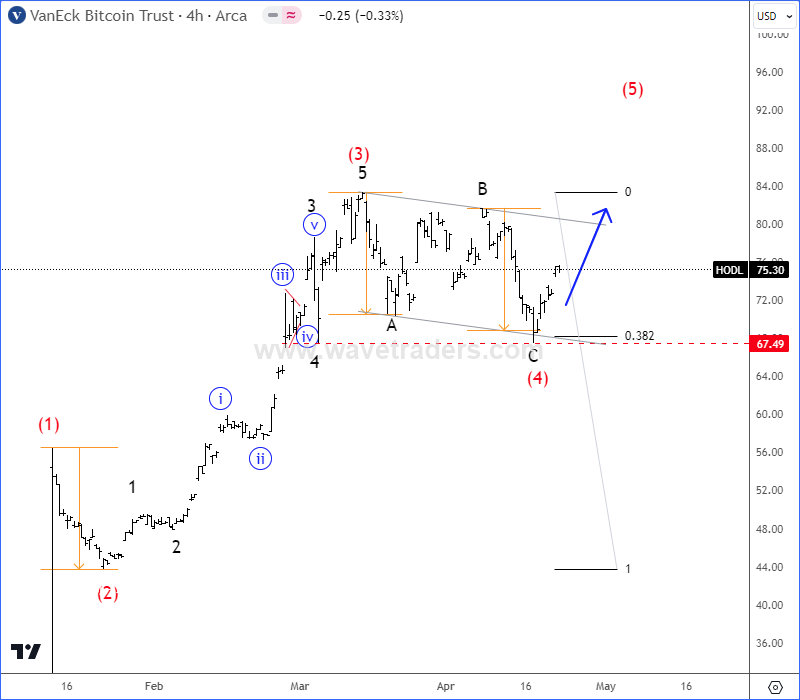
Even new-listed VanEck Bitcoin Trust ETF (HODL) is looking for a bullish continuation within wave (5) of an impulse from the lows after recent nice and clean A-B-C correction in wave (4).
HODL four-hour chart from April 23 2024
For a detailed view and more analysis like this you may want to watch below our recording of a latest live webinar streamed on April 22 2024:
Get Full Access To Our Premium Elliott Wave Analysis For 14 Days. Click here.