

- The daily RSI signals growing buying momentum for the EUR/JPY.
- The daily MACD also shows a strengthening buying momentum.
- On the hourly chart, the same indicators reveal signs of a more immediate buyer dominance.
The EUR/JPY rose towards 165.64 on Tuesday’s session, its highest level since 2008, showcasing clear bullish signals that point to further gains. With buyers in command, the overall landscape for the pair can be viewed as bullish.
On the daily chart, the Relative Strength Index (RSI) shows an ascending trend for the, moving deep in positive terrain. Concurrently, the Moving Average Convergence Divergence (MACD) backs this outlook as its histogram displays ascending green bars, underscoring the positive momentum.
In contrast, the insight from the hourly chart provides a slightly different perspective. While the RSI also showcases an uptrend into positive territory, the current level was higher than that of the daily chart, hinting at a more immediate upward momentum. Simultaneously, the MACD on the hourly chart strengthens the bullish bias, evident from the rising green bars.
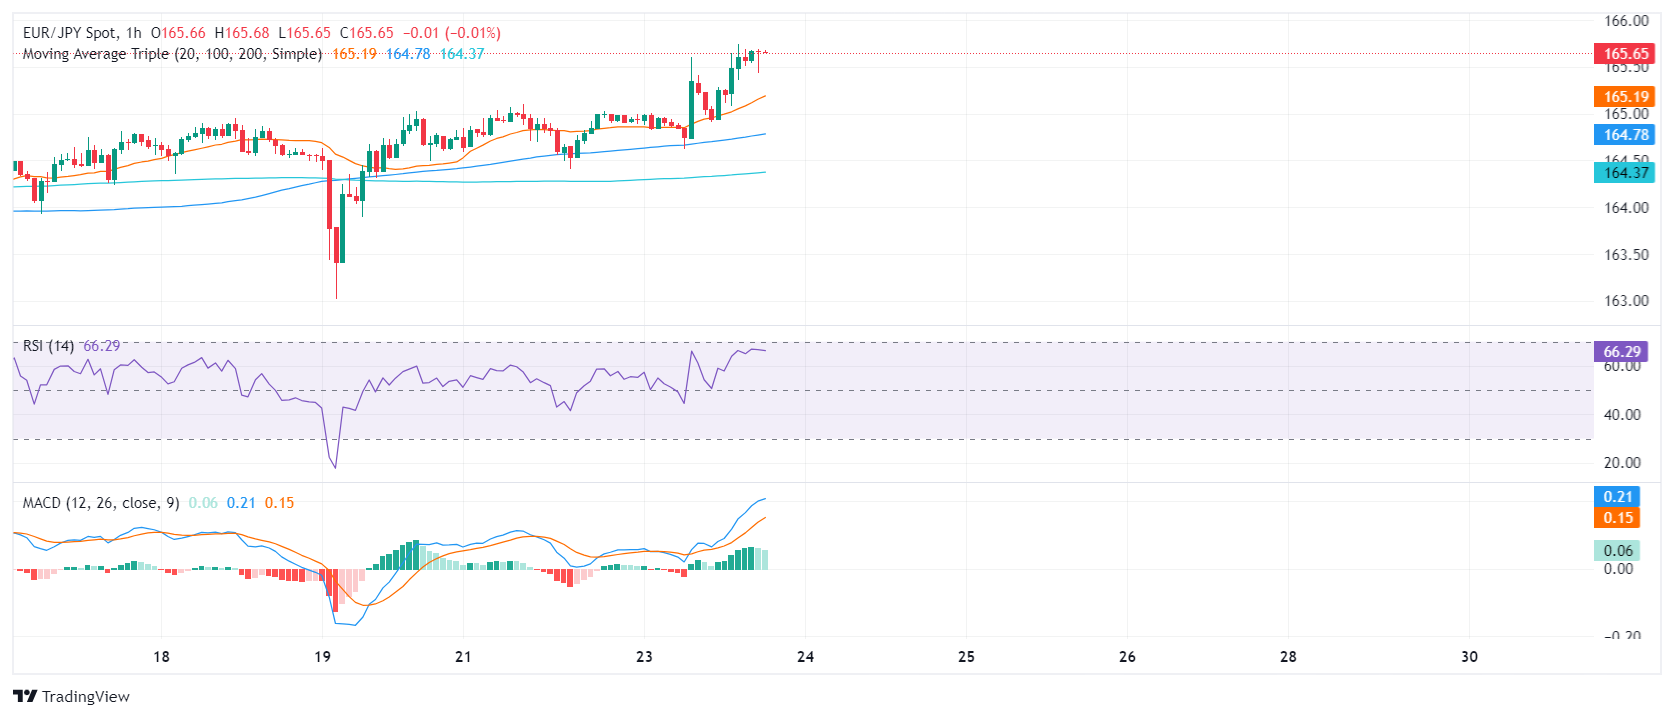
Observing the broader view, the EUR/JPY stands above its 20, 100, and 200-day Simple Moving Average (SMA), suggesting a strong bullish trend both in the short and long-term perspectives. Overall, bears show no signs of recovering and as bulls capture fresh multi-year highs, there are no technical signals that threaten the clear bullish trend.