

- The RSI of the NZD/USD daily chart recovered but remains on negative terrain.
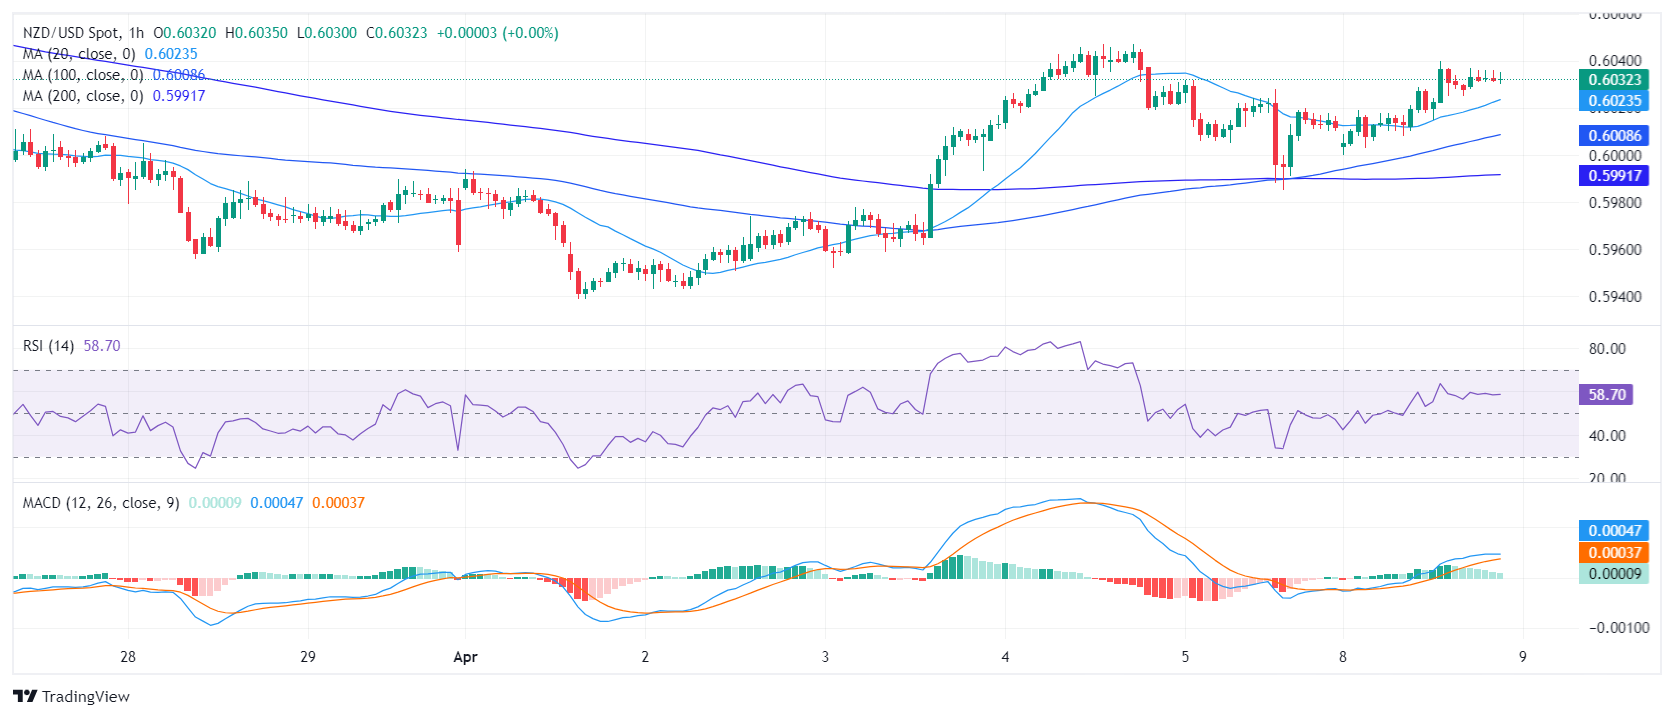
- The hourly RSI readings signal a possible short-term bullish trend, largely maintaining above the 50 level throughout Monday’s session.
- As long as the pair remains below its main SMAs, buying signals won’t be credible.
The NZD/USD pair is currently trading at 0.6033, tallying daily gains on Monday’s session. Despite these gains, the situation is delicate for buyers as signs of short-term bullish tendencies are guaranteed, while the bearish momentum maintains a strong hold over the pair’s broader outlook.
On the daily chart, the Relative Strength Index (RSI) continues to indicate bearish momentum, underscoring the pair’s shift into negative territory since mid-March. Despite slight recoveries within the previous sessions, these movements remain insufficient to push the indicator above the 50 threshold, thereby maintaining the bearish outlook. On the positive side, the Moving Average Convergence Divergence (MACD) prints green bars, which shed a bit of light for the buyers, as it hints that momentum in mounting.
Shifting to the hourly chart, the RSI values reveal a contrasting, more positive trend, with most of today’s session hovering above the 50 level. Meanwhile, the MACD on this same hourly chart prints decreasing green bars, showing a tempering down of bullish momentum.
In conclusion, the are some hints of buyers gathering momentum on the daily and hourly chart. That being said, considering a more comprehensive view, where the pair still falls short of the 20,100, 200-day SMA, investors should tread cautiously around this short-term bullishness and stay aware of the larger bearish trend at play.