
- The USD Index (DXY) hit fresh tops around 106.00.
- Investors continue to price in the Fed’s first rate cut in September.
- Hotter-than-expected US CPI prints fuel the Dollar’s rally.
- Upcoming Fedspeak could drive the USD’s valuation.
The Greenback advanced for the third consecutive session on Friday, taking the USD Index (DXY) just beyond the 106.00 barrier, an area last traded in early November.
The resumption of the intense sentiment towards the Greenback has gathered extra steam after US inflation figures, gauged by the Consumer Price Index (CPI) released earlier this week, showed headline prices came in above estimates, while prices stripping food and energy costs also remained sticky during March.
The unexpected loss of momentum of disinflationary pressures not only adds further credence to the unabated resilience of the economy but it also props up the idea that the Federal Reserve (Fed) might extend its tighter-for-longer narrative.
On the latter, the probability of the start of the Fed’s easing cycle in June has reduced dramatically to around 20% when measured by the CME Group’s FedWatch Tool from the 60% expected before the release of March’s CPI data. Meanwhile, investors have already started to pencil in a potential 25 bps interest rate cut at the bank’s September gathering.
It is worth noting that a persistently tight labour market continues to underpin the view of a healthy economy, favouring a “soft landing” scenario for the economy and contributing to the idea of a rate reduction later than previously anticipated.
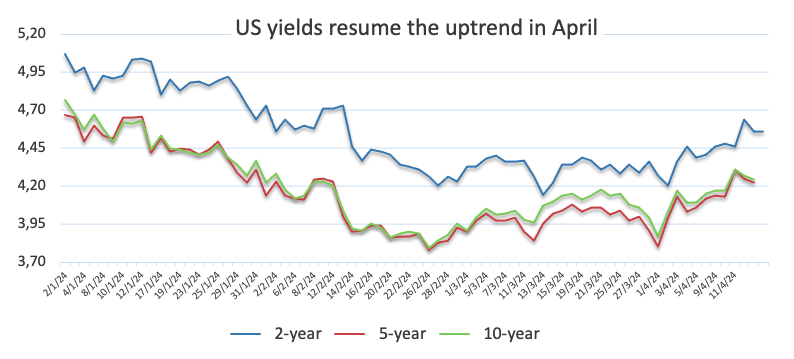
The Dollar’s positive performance this week coincided with the climb to multi-month peaks in US yields across different maturity periods, always against the renewed macro environment that points to just one or two rate cuts for the remainder of the year.
Fedspeak seems to lean towards fewer rate cuts
In tandem with the sharp advance in the US Dollar and yields, Fed’s rate setters were also quite vocal during the week in favour of maintaining the current restrictive stance for a longer period.
Minneapolis Fed President Neel Kashkari emphasised that prospective rate decreases for this year may be jeopardised if inflation continues to be low. Chicago Fed President Austan Goolsbee highlighted the need for the Fed to contemplate the consequences of a tight monetary approach. Meanwhile, FOMC Governor Michelle Bowman stated that attempts to reduce inflation have faced challenges. In addition, New York Fed President John Williams remarked that, while the central bank has made substantial achievements in decreasing inflation, it is not yet appropriate to shift to a looser monetary policy stance due to recent price changes. Finally, Boston Fed President Susan Collins said she is considering two interest rate decreases this year, predicting that it may take some time to bring inflation down to targeted levels, and Atlanta Fed President Raphael Bostic suggested that if progress on inflation stalls and the economy continues to outperform, there is a possibility that the Fed might refrain from cutting interest rates altogether this year.
If we add the latest comments from Chairman Jerome Powell arguing that there is no haste to begin lowering interest rates, it does not surprise the sudden and strong change of heart around the Greenback and the shift of investors’ expectations to a later rate cut.
Assessing potential interest rate trends
When analyzing central banks and inflation dynamics within the G10 group, there are expectations that the European Central Bank (ECB) will likely lower its interest rates sometime around the summer months, possibly followed by the Bank of England (BoE). In contrast, both the Fed and the Reserve Bank of Australia (RBA) are anticipated to begin their easing cycles later in the year, possibly in the fourth quarter. Despite increasing its policy rate by 10 basis points after 17 years during its March meeting, the Bank of Japan (BoJ) still stands as an outlier.
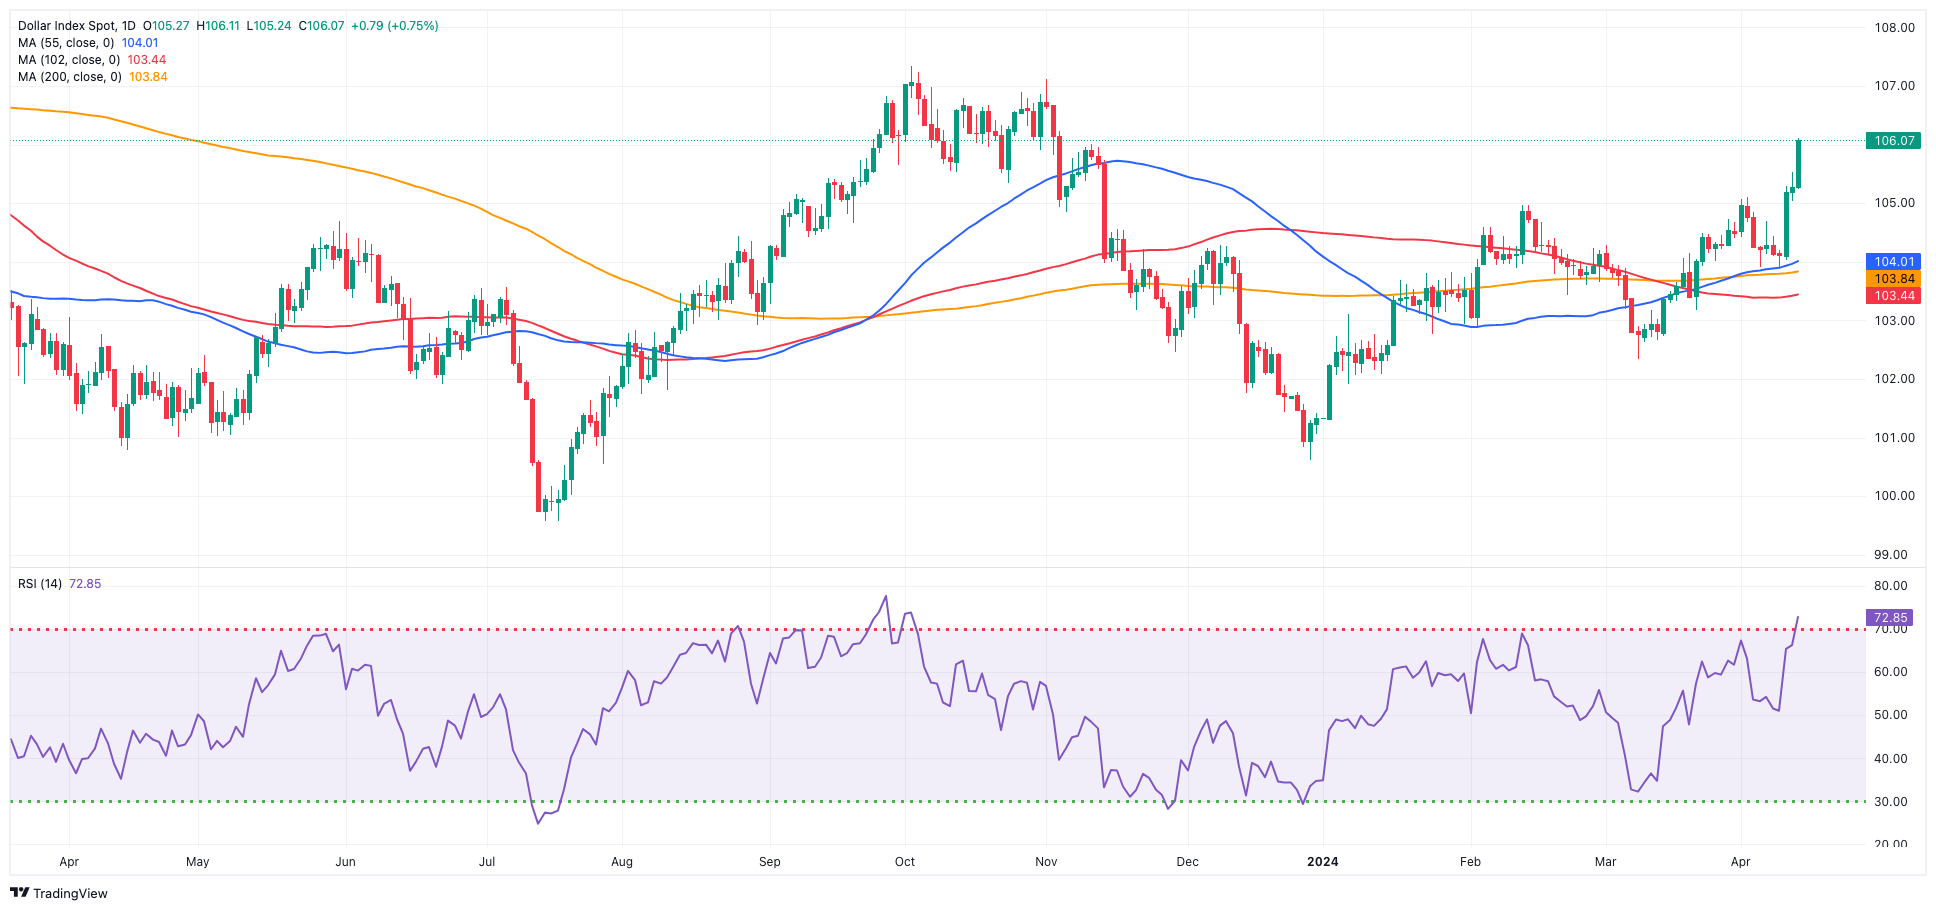 DXY technical outlook
The daily chart suggests an impending resistance zone at the November high of 107.11 (November 1) just ahead of the 2023 top of 107.34 (October 3).
In the opposite direction, the 200-day Simple Moving Average (SMA) at 103.84 could provide initial and solid resistance before the temporary 100-day SMA at 103.47 and the March low of 102.35. If the index falls further, it might approach its December low of 100.61, established on December 28, which precedes the critical 100.00 barrier and the 2023 low of 99.57, set on July 14.
Maintaining a sustainable position above the 200-day SMA is indicative that further gains should remain well on the cards.
US Dollar price this week
The table below shows the percentage change of US Dollar (USD) against listed major currencies this week. US Dollar was the weakest against the Japanese Yen.
| USD | EUR | GBP | CAD | AUD | JPY | NZD | CHF | |
| USD | 1.86% | 1.51% | 1.20% | 1.54% | 0.81% | 1.08% | 0.91% | |
| EUR | -1.89% | -0.35% | -0.67% | -0.31% | -1.05% | -0.78% | -0.95% | |
| GBP | -1.54% | 0.35% | -0.32% | 0.03% | -0.71% | -0.44% | -0.60% | |
| CAD | -1.21% | 0.67% | 0.32% | 0.36% | -0.38% | -0.10% | -0.29% | |
| AUD | -1.56% | 0.31% | -0.04% | -0.35% | -0.74% | -0.47% | -0.65% | |
| JPY | -0.82% | 1.04% | 0.70% | 0.40% | 0.71% | 0.29% | 0.10% | |
| NZD | -1.09% | 0.77% | 0.43% | 0.12% | 0.46% | -0.26% | -0.17% | |
| CHF | -0.92% | 0.95% | 0.64% | 0.29% | 0.69% | -0.10% | 0.17% |
The heat map shows percentage changes of major currencies against each other. The base currency is picked from the left column, while the quote currency is picked from the top row. For example, if you pick the Euro from the left column and move along the horizontal line to the Japanese Yen, the percentage change displayed in the box will represent EUR (base)/JPY (quote).


