

DIS Elliott Wave analysis trading lounge daily chart
The Walt Disney Company, (DIS) Daily Chart.
DIS Elliott Wave Technical Analysis.
Function: Trend.
Mode: Impulsive.
Structure: Motive.
Position: Wave (1).
Direction: Upside in wave 5 of (1).
Details: After a major bear market that lasted 3 years we have seen support on top of TL1 at 100$. As we are continuing higher we could be facing support at the end of MG1 at 130$.
DIS Elliott Wave technical analysis – Daily chart
Our analysis indicates a trending function characterized by impulsive mode and motive structure, positioned in Wave (1). The direction signals an upside momentum in wave 5 of (1). Following a significant bear market spanning three years, we’ve observed support atop TL1 at $100. As we continue to ascend, potential support may emerge around the conclusion of MG1 at $130.
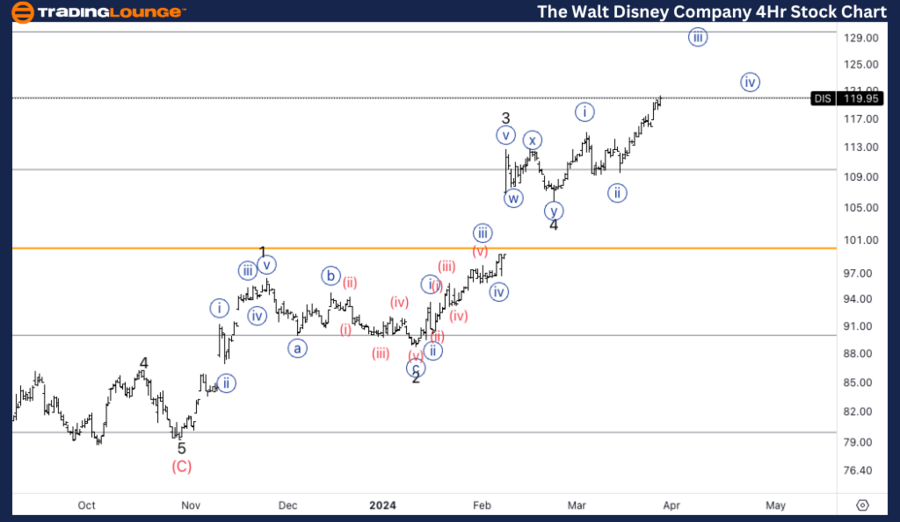
DIS Elliott Wave analysis trading lounge four-hour chart
The Walt Disney Company, (DIS) 4H Chart.
DIS Elliott Wave Technical Analysis.
Function: Trend.
Mode: Impulsive.
Structure: Motive.
Position: Wave {iii} of 5.
Direction: Upside in wave {iii}.
Details: Here we are displaying a bit of a different count with a smaller wave 4 and a clear {i}-{ii} within wave 5.
DIS Elliott Wave technical analysis – Four-hour chart
Here, we also identify a trending function marked by impulsive mode and motive structure, positioned in Wave {iii} of 5. The direction indicates an upside trajectory in wave {iii}. Our count reveals a nuanced perspective, depicting a smaller wave 4 and a clear {i}-{ii} delineation within wave 5.
Technical analyst: Alessio Barretta.
Welcome to our DIS Elliott Wave Analysis Trading Lounge, where we dive into The Walt Disney Company (DIS) using Elliott Wave Technical Analysis. Let’s uncover the market dynamics on the Daily Chart.
The Walt Disney Company Elliott Wave technical analysis [Video]