The S&P 500 index rallied again on Friday, reaching a new all-time high of 5,030.06, following record-breaking rallies in the AI/tech sector, with Microsoft and Nvidia leading the way up. It broke above the 5,000 level, and after that it quickly added another 30 points, closing 0.57% higher.
Recently, my short-term outlook was still neutral because the market seemed overbought and ready for a downward correction. When in doubt, it’s better to stay out of a position than to try to catch a top and open a short position too early.
Although a downward correction is widely expected, the overall market sentiment remains bullish, and the index may reach more records. This morning, futures contracts indicate that stocks are likely to open virtually flat, yet still very close to all-time highs.
Investor sentiment remains very elevated; last Wednesday’s AAII Investor Sentiment Survey showed that 49.0% of individual investors are bullish, while only 22.6% of them are bearish. The AAII sentiment is a contrary indicator in the sense that highly bullish readings may suggest excessive complacency and a lack of fear in the market. Conversely, bearish readings are favorable for market upturns.
Last Wednesday, I mentioned that “We may have to deal with a correction or consolidation of several weeks of advances. With the season of quarterly earnings announcements coming to an end and a series of important economic data, profit taking may follow.”
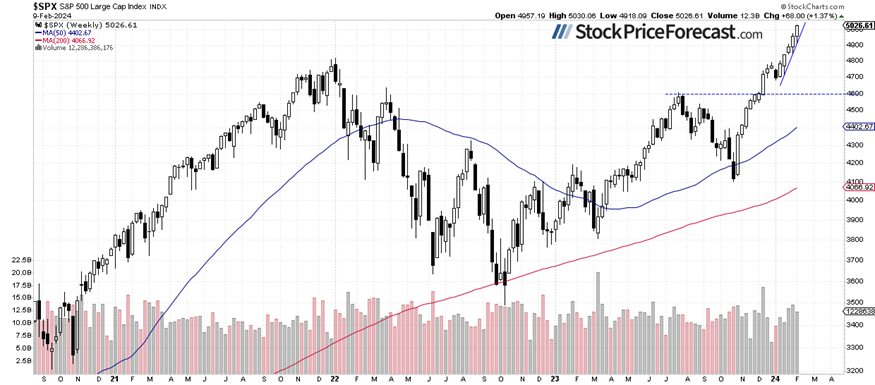
The S&P 500 is likely to retrace a part of its recent advances at some point. The market may get back to a month-long upward trend line, which right now, is at around 4,950, as we can see on the daily chart.
S&P 500: Month-long rally
The weekly chart of the S&P 500 reveals an over month-long rally, starting from early January. The market has been accelerating its medium-term uptrend since a relatively flat correction in December. However, there are indications that another correction or consolidation may be in the cards.
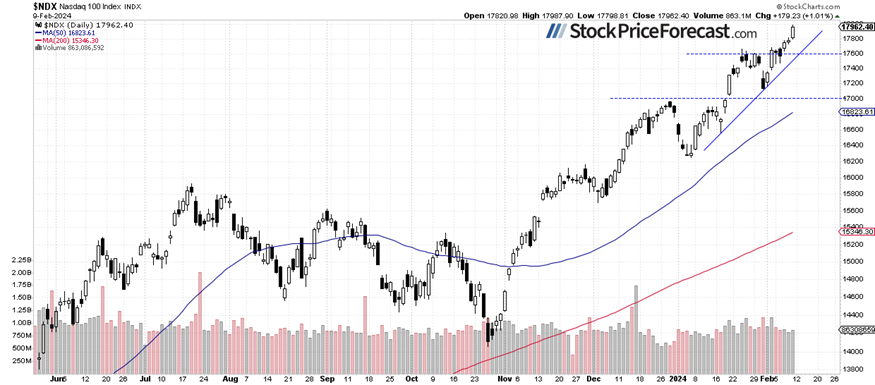
Nasdaq 100 accelerated towards 18,000
On Friday, the technology-focused Nasdaq 100 index reached a new all-time high at 17,987.90. Recently, it has been relatively weaker than the broader stock market, but last week, it caught up with the S&P 500. However, Nasdaq’s rally was led by a handful of “FANG” stocks like META, NVDA and MSFT. Last Wednesday, I wrote about the NYSE FANG+ index.
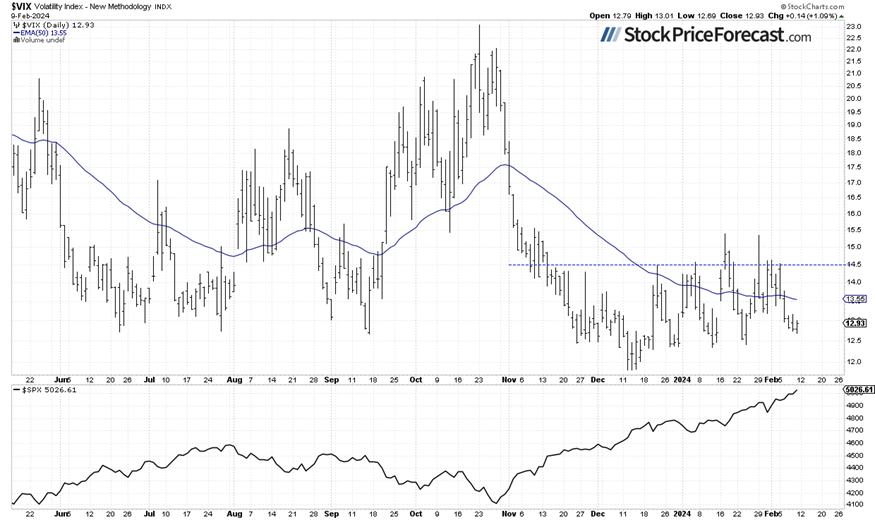
VIX remains close to 13
The VIX index, also known as the fear gauge, is derived from option prices. Last week, it fell below the 13 level, indicating a lack of fear in the market as stock prices reached record highs.
Historically, a dropping VIX indicates less fear in the market, and rising VIX accompanies stock market downturns. However, the lower the VIX, the higher the probability of the market’s downward reversal.
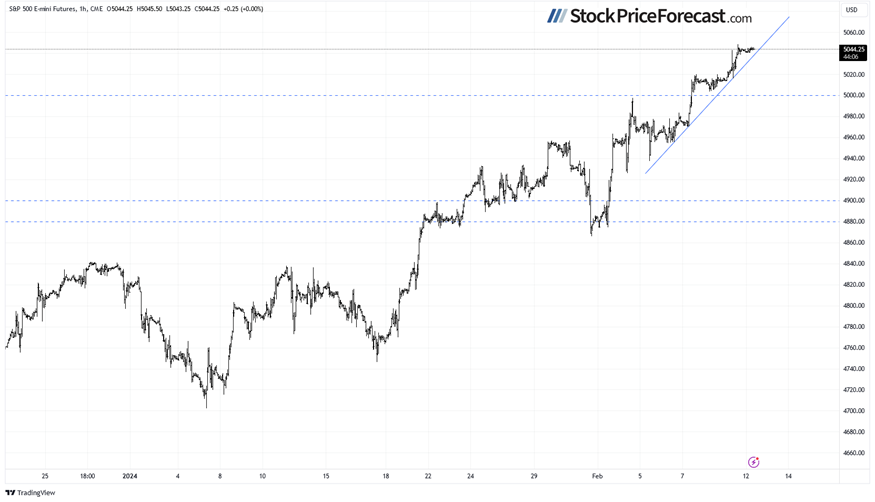
Futures trades along record high
Let’s take a look at the hourly chart of the S&P 500 futures contract. This morning, it’s trading slightly below the 5,050 level, going sideways after the Friday’s rally. The support level remains at 5,000-5,020, marked by the recent consolidation.
Conclusion
Last week’s trading action was very bullish, with some of the tech stocks rallying to new record highs, the S&P 500 index breaking above 5,000, and the Nasdaq 100 index getting close to 18,000. However, in the short term, the possibility of a downward correction cannot be overlooked. A quick glance at the chart reveals that the S&P 500 index has recently become more volatile.
Tomorrow before the cash market session opens, a very important Consumer Price Index release is expected. It is likely to cause an increased volatility. The expectations are bullish for stocks, considering last week’s downwards revision of the previous CPI release. However, a ‘buy rumor, sell facts’ reaction may occur thereafter.
On December 21, I mentioned that “in a short-term the market may see some more uncertainty and volatility”, and indeed, there was a lot of uncertainty following the early-December rally and the breakout of the S&P 500 above the 4,700 level. However, the recent weeks’ price action left no illusions of a potential medium-term trend reversal. On January 30, I noted that “The market is overbought in the short term, but predicting a correction is currently very challenging.”. This still holds true; last week, the market rallied even further.
For now, my short-term outlook remains neutral.
Here’s the breakdown:
-
The S&P 500 is likely to retrace a part of its last week’s rally at some point.
-
The market appears overbought in the short term, but no negative signals are evident.
-
In my opinion, the short-term outlook is neutral.
The full version of today’s analysis – today’s Stock Trading Alert – is bigger than what you read above, and it includes the additional analysis of the Apple (AAPL) stock and the current S&P 500 futures contract position. I encourage you to subscribe and read the details today. Stocks Trading Alerts are also a part of our Diamond Package that includes Gold Trading Alerts and Oil Trading Alerts.
And if you’re not yet on our free mailing list, I strongly encourage you to join it – you’ll stay up-to-date with our free analyses that will still put you ahead of 99% of investors that don’t have access to this information. Join our free stock newsletter today.
Want free follow-ups to the above article and details not available to 99%+ investors? Sign up to our free newsletter today!