Unlocking ASX Trading Success: REA GROUP LTD – REA Stock Analysis & Elliott Wave Technical Forecast.
ASX: REA GROUP LTD – REA Elliott Elliott Wave Technical Analysis TradingLounge (1D Chart).
Greetings, Our Elliott Wave analysis today updates the Australian Stock Exchange (ASX) with REA GROUP LTD – REA shares. We determined that REA could continue to push higher with the Impulse wave.
ASX: Rea Group LTD – Rea Elliott Wave technical analysis
ASX: REA GROUP LTD – REA 1D Chart (Semilog Scale) Analysis.
Function: Major trend (Minor degree, red).
Mode: Motive.
Structure: Impulse.
Position: Wave 3-red of Wave (5)-blue.
Details: The short-term outlook suggests that wave (5)-blue is unfolding and may continue to push higher. This view will be reaffirmed if the price accelerates convincingly above the high at 194.81. If this scenario plays out, wave 3-red is expected to return and push even higher. And the low at 174.95 can act as a potential Stop level.
Invalidation point: 140.50.
ASX: REA GROUP LTD – REA Elliott Wave Technical Analysis TradingLounge (4- Hour Chart).
ASX: Rea Group LTD – Rea Elliott Wave technical analysis
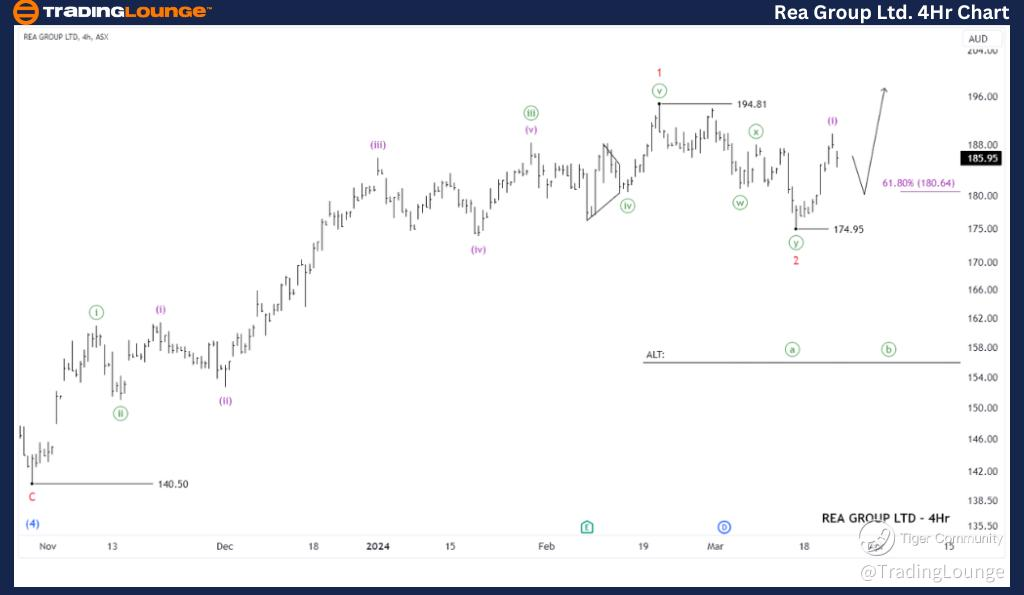
ASX: REA GROUP LTD – REA 4-Hour Chart Analysis.
Function: Major trend (Minor degree, red).
Mode: Motive.
Structure: Impulse wave.
Position: Wave (ii)-purple of Wave 3-red.
Details: Further short-term outlook suggests that wave 2-red may have concluded, and wave 3-red is now unfolding to push higher. At a smaller degree, wave (i)-purple has peaked, and wave (ii)-purple may be underway to pull back lower and will find support around 180.64, followed by wave (iii)-purple resuming the upward momentum.
Invalidation point: 174.95.
Conclusion:
Our analysis, forecast of contextual trends, and short-term outlook for ASX: REA GROUP LTD – REA aim to provide readers with insights into the current market trends and how to capitalize on them effectively. We offer specific price points that act as validation or invalidation signals for our wave count, enhancing the confidence in our perspective. By combining these factors, we strive to offer readers the most objective and professional perspective on market trends.
Technical Analyst: Hua (Shane) Cuong, CEWA-M (Master’s Designation).