
Oil stocks broke above important resistances, hitting a fresh multi-year peak. Is this the end of the bears?
Technical picture of the XOI
In recent days crude oil reversed and jumped above the early March peaks, breaking above the barrier of $80. Earlier this week, the S&P500 moved above 5200 and hit a fresh peak during yesterday’s session. What happened at the same time with oil stocks? In today’s article, we’ll take a look at the current technical situation and shed some light on the potential threats that may impact oil bulls in the coming week. Have a nice read!
Let’s start today’s analysis with the medium-term chart.
From this perspective, we see that the XOI broke not only above the red resistance line based on late 2022 and early 2023 peaks (which was strong enough to keep gains in check in Sep. and Oct. 2023), the red resistance zone created by the previous highs, but also above the red dashed resistance line based on even earlier peaks.
Thanks to these positive developments, a big white candle was formed on the chart, but…. we should keep in mind that the week is not over yet.
Is there anything that could stop Oil bulls?
Let’s examine the monthly chart to find out.
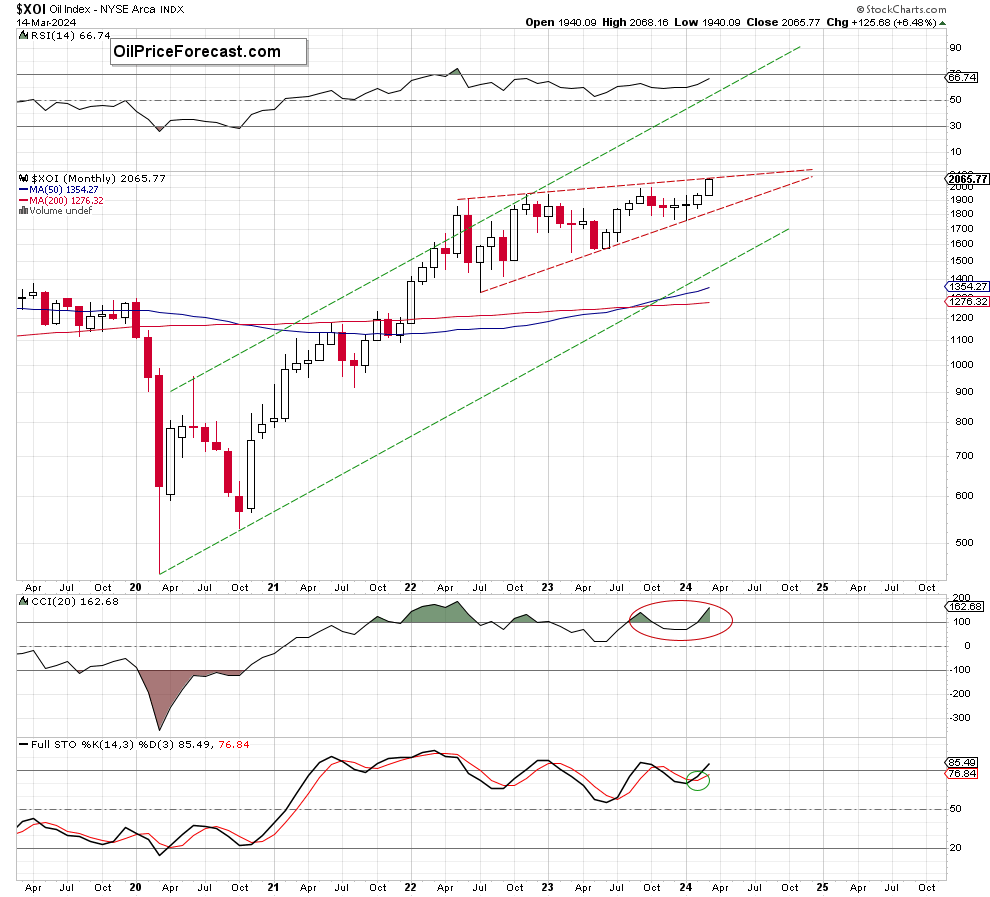
When we take a look at the oil stocks index from the broader perspective, we see that the XOI climbed to the upper border of the red rising wedge, which could encourage the sellers to check their opponents’ determination to fight for higher values of the index – especially when we mix this picture with the current situation in the short term.
What do I mean by that?
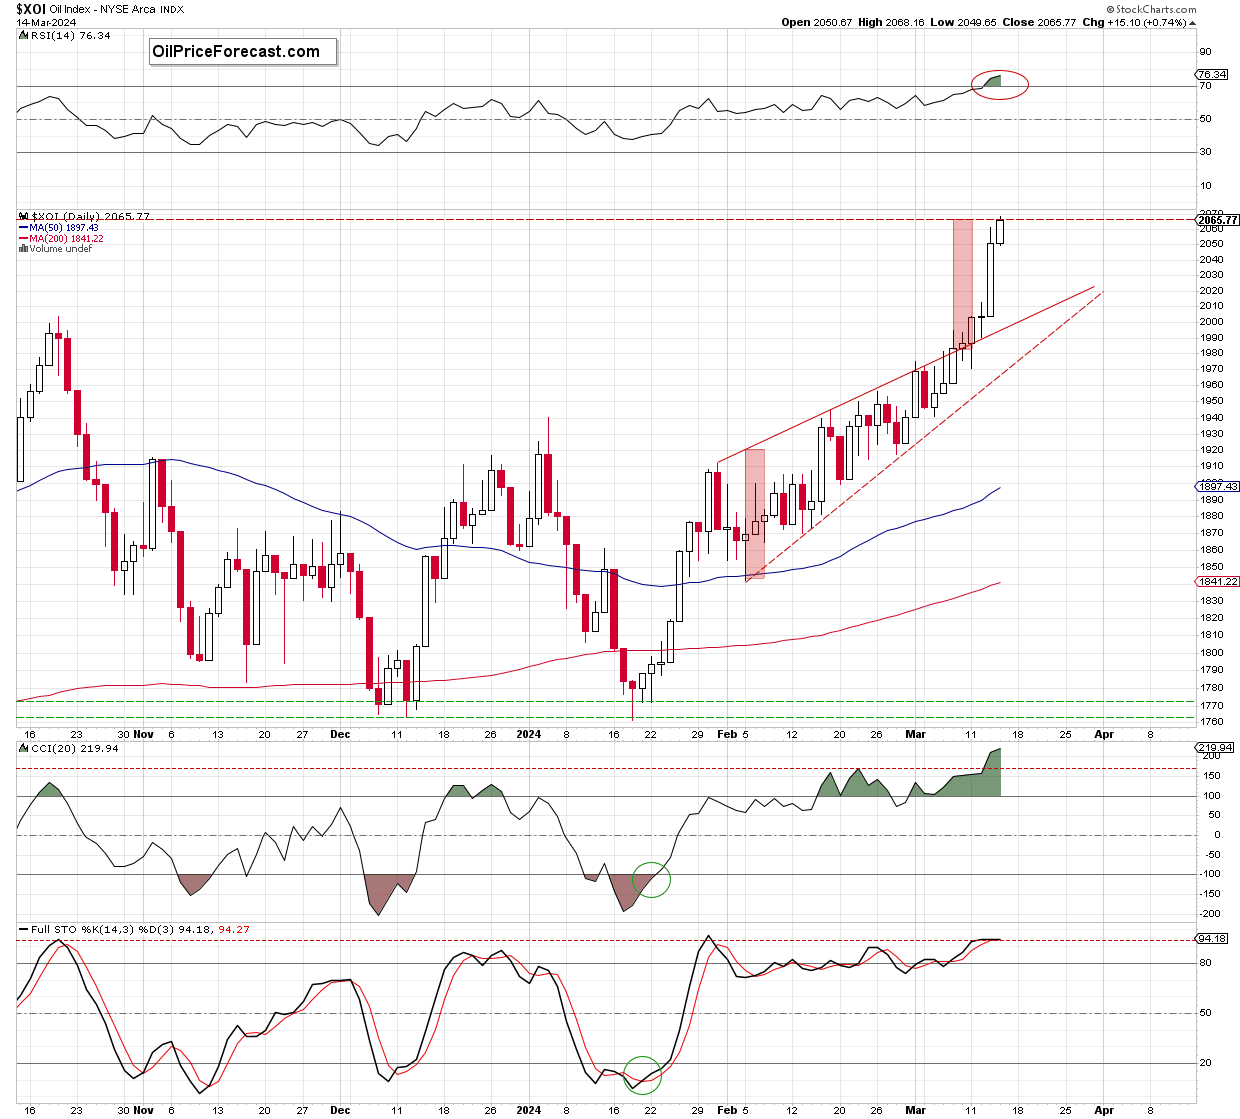
Looking at the daily chart, we see that oil stocks broke above the upper line of the red rising wedge, triggering further improvement in the following days.
Thanks to the buyers’ activity, the XOI broke above 2,000 and hit a fresh multi-year high of 2,068.16 during yesterday’s session. In this way, oil stocks moved to the area where the size of the upward move corresponded to the height of the red rising wedge (marked with the red rectangles), which could encourage the bears to show their claws and trigger a reversal in the very near future – especially when we factor in the above-mentioned upper border of the bigger and wider rising wedge marked on the long-term chart.
Nevertheless, in my opinion, as long as the XOI remains above the resistances marked on the weekly chart (especially the red zone based on the previous peaks), a bigger move to the downside is not a sure bet, and all downswings would be nothing more than verifications of the earlier breakout.
Summing up, the XOI broke above important resistances and hit a fresh multi-year high. However, taking into account the long-term resistance that emerged from the monthly chart and the fact that the current upward move is equal to the height of the rising wedge (marked on the daily chart), I think it is worth being more attentive to the current levels and carefully observing the behavior of market participants, because any signs of bullish weakness can be quickly exploited by their rivals to bring the index back to last year’s peaks.
Want free follow-ups to the above article and details not available to 99%+ investors? Sign up to our free newsletter today!


