As our members know, NASDAQ has recently given us good buying opportunities. In this technical article we’re going to present another Elliott Wave trading setup we have had recently. NQ_F made pull back that has unfolded as Elliott Wave Double Three pattern. It made clear 3 waves down from the February 23rd peak and completed correction right at the Equal Legs zone ( Blue Box Area) . In further text we’re going to explain the Elliott Wave pattern and trading setup.
Nasdaq Elliott Wave one hour chart 02.28.2024
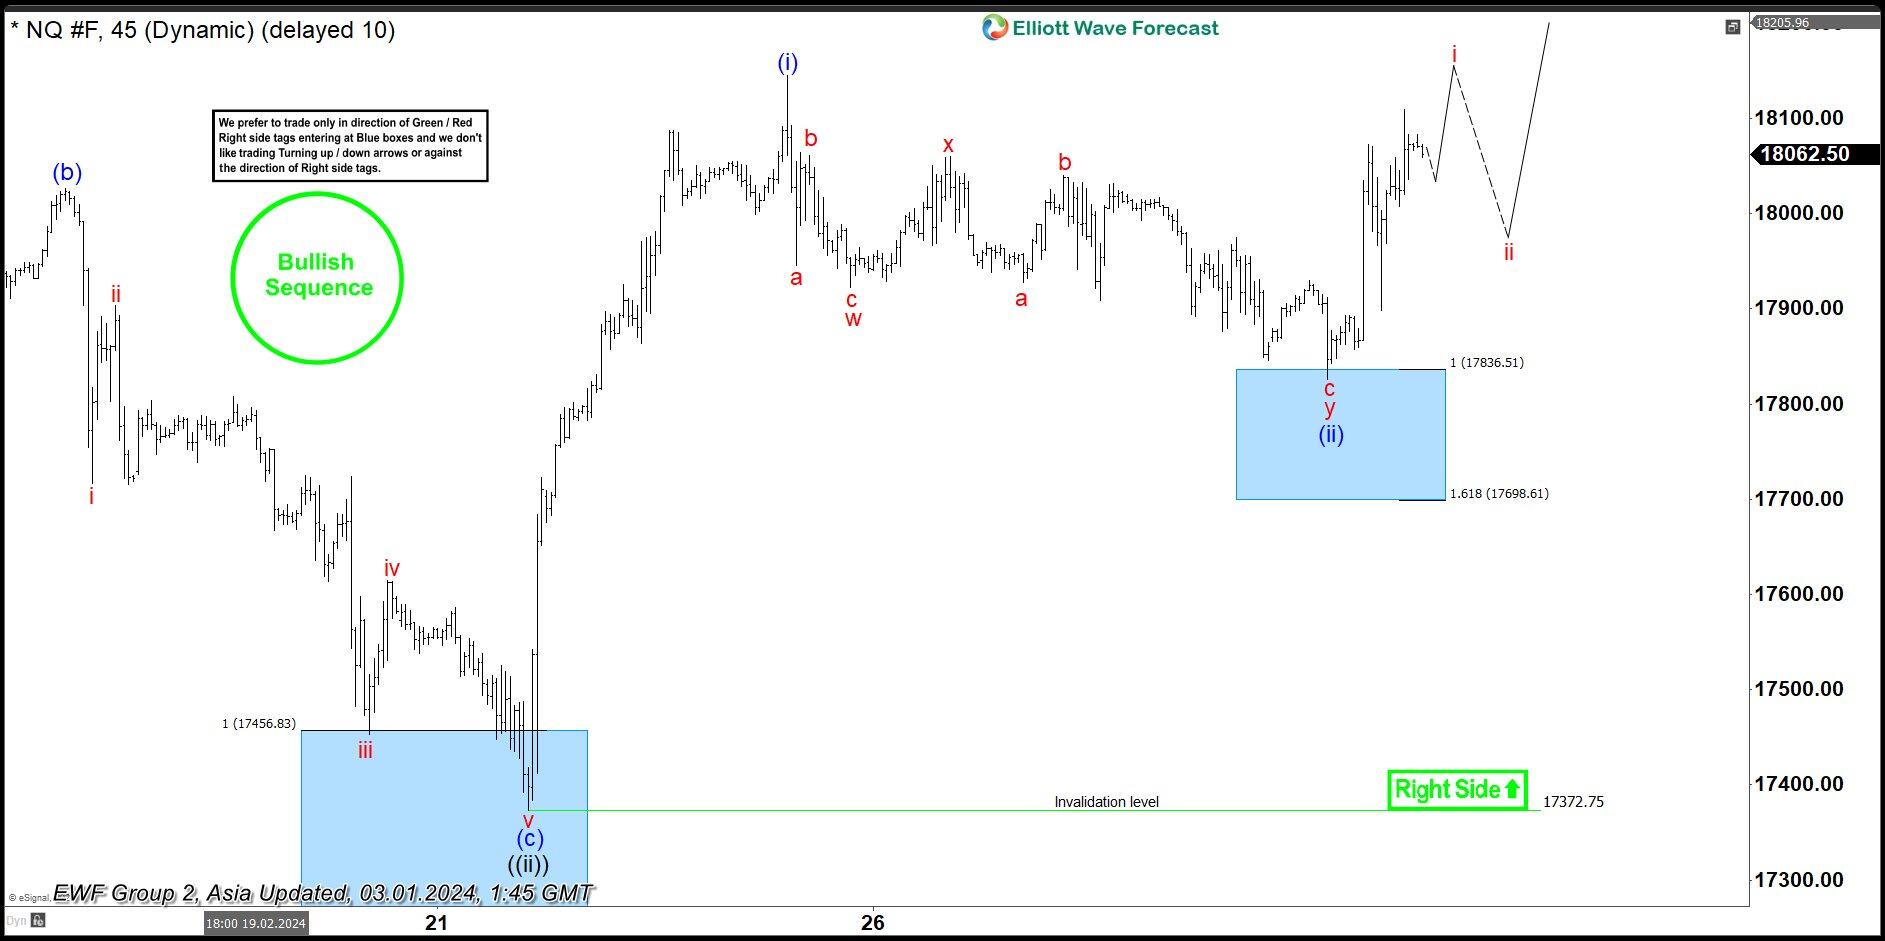
NASDAQ shows lower low sequences from the peak, suggesting intrady pull back is still in progress. Correction has wxy red labeling. The price structure is incomplete at the moment, calling for a more downside toward 17836.5-17698.6 area. We don’t recommend selling NASDAQ and prefer the long side from the marked Blue Box ( buying zone). Once NQ_F reaches our buying area, we expect it to find buyers and make either rally toward new highs or in 3 waves bounce alternatively. Invalidation of the trade would be break below 1.618 fib ext: 17698.6
Official trading strategy on How to trade 3, 7, or 11 swing and equal leg is explained in details in Educational Video, available for members viewing inside the membership area.
Nasdaq Elliott Wave one hour chart 02.28.2024
NQ_F reached our buying zone at : 17836.5-17698.6 and found buyers as expected. NASDAQ is giving us very good reaction from the Blue Box Area. We call pull back (ii) blue completed at the 17828 low. Consequently, any long positions should be risk free by now. We would like to see break of (i) blue peak (February 23rd) to confirm next leg up is in progress.