
Stock prices were rebounding on Friday, with the S&P 500 index gaining 1.11% and closing above the 5,200 level. The sentiment improved after a better-than-expected monthly jobs data. The market retraced most of its Thursday’s decline of 1.2%, but it seems that there will likely be some more uncertainty as investors await key consumer inflation data on Wednesday.
Last Tuesday, in my Stock Price Forecast for April, I noted, “Closing the month of March with a gain of 3.1%, the question arises: Will the S&P 500 further extend the bull market in April, or is a downward correction on the horizon? From a contrarian standpoint, such a correction seems likely, but the overall trend remains bullish.”
The investor sentiment has slightly worsened before Thursday’s and Friday’s volatility, as indicated by the last Wednesday’s AAII Investor Sentiment Survey, which showed that 47.3% of individual investors are bullish, while only 22.2% of them are bearish. The AAII sentiment is a contrary indicator in the sense that highly bullish readings may suggest excessive complacency and a lack of fear in the market. Conversely, bearish readings are favorable for market upturns.
This morning, the S&P 500 is expected to open virtually flat, with the futures contract trading sideways. On Thursday, it broke its two-month-long upward trend line, as we can see on the daily chart.
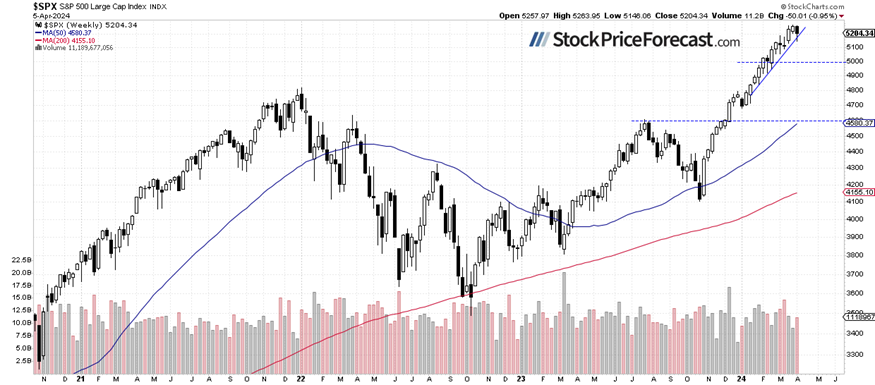
S&P 500 – More uncertainty on a weekly timeframe
Compared to the previous Friday’s closing price, the index lost 0.95%, but it managed to remain above the 5,200 level. Short-term consolidation near the new records may suggest that the market is potentially topping out, though no clearly negative signals are evident yet.
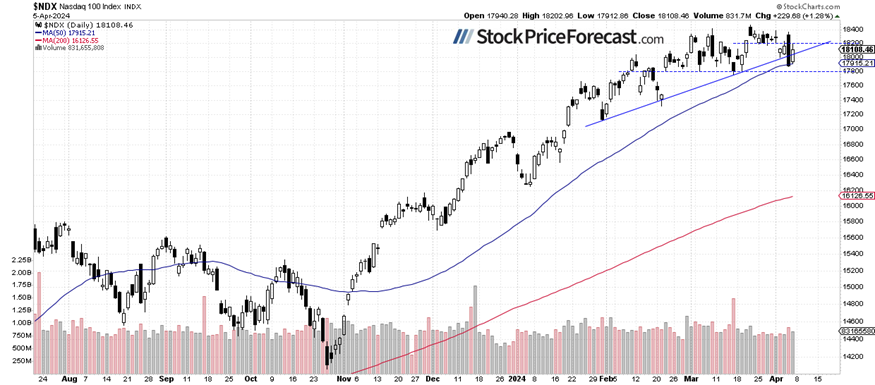
Nasdaq 100 – Two-month-long consolidation
On Thursday, the technology-focused Nasdaq 100 index rebounded close to its March 21 record high of 18,464.70, but then, it sold off, closing below the 18,000 level. On Friday, it retraced some of the decline and broke the 18,000 level again. The technology index continues to trade within a two-month-long consolidation.
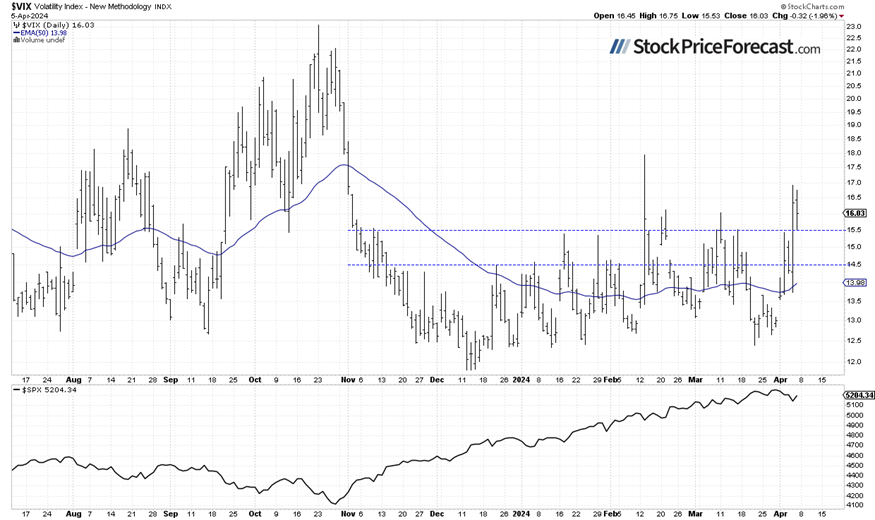
VIX remains close to 16
The VIX index, also known as the fear gauge, is derived from option prices. In late March, it was trading around the 13 level, and last week, market volatility increased, leading to an advance towards 16-17.
Historically, a dropping VIX indicates less fear in the market, and rising VIX accompanies stock market downturns. However, the lower the VIX, the higher the probability of the market’s downward reversal.
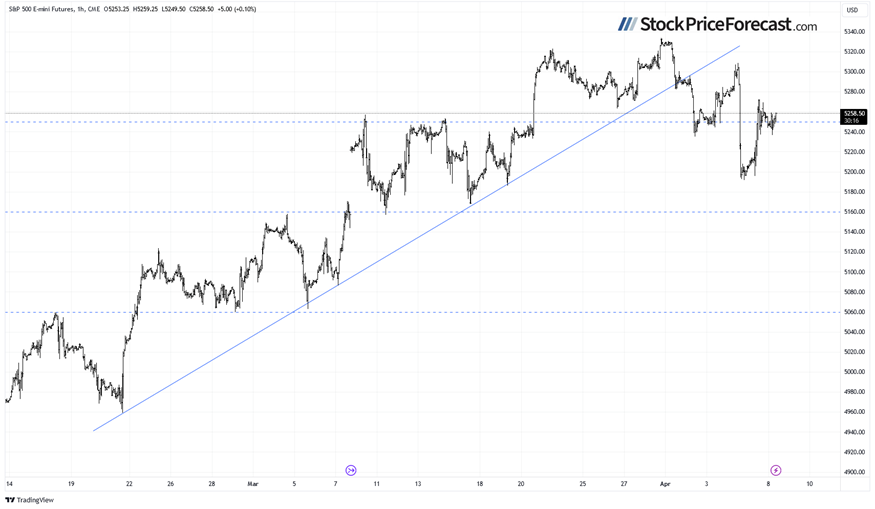
Futures contract – Short-term consolidation
Let’s take a look at the hourly chart of the S&P 500 futures contract. On Thursday, it sold off to around 5,200, and on Friday, it bounced to around 5,270 following monthly jobs data release. This morning, it’s basically going sideways, with the support level at 5,240 and the resistance at 5,270.
Conclusion
Today’s trading session is likely to open virtually flat for the S&P 500 index. The markets are eagerly awaiting the important Consumer Price Index release on Wednesday, and we may see a consolidation leading up to that announcement. It’s also worth noting that the earnings season is approaching in mid-month.
Last Tuesday, I wrote that “In April, we will see a usual series of important economic data, but with the Fed leaning towards easing monetary policy, we should perhaps pay more attention to the quarterly earnings season. However, good earnings may be met with a profit-taking action this time. The market appears to be getting closer to a correction.”
On Thursday, I added: “It appears that profit-taking is happening. Is this a new downtrend? Likely not, however, a correction towards 5,000-5,100 is possible at some point.”
For now, my short-term outlook remains neutral.
Here’s the breakdown:
-
The S&P 500 is poised to extend its consolidation ahead of the CPI release on Wednesday.
-
In the medium term, stock prices remain somewhat overbought, suggesting the potential for a correction.
-
In my opinion, the short-term outlook is neutral.
The full version of today’s analysis – today’s Stock Trading Alert – is bigger than what you read above, and it includes the additional analysis of the Apple (AAPL) stock and the current S&P 500 futures contract position. I encourage you to subscribe and read the details today. Stocks Trading Alerts are also a part of our Diamond Package that includes Gold Trading Alerts and Oil Trading Alerts.
And if you’re not yet on our free mailing list, I strongly encourage you to join it – you’ll stay up-to-date with our free analyses that will still put you ahead of 99% of investors that don’t have access to this information. Join our free stock newsletter today.
Want free follow-ups to the above article and details not available to 99%+ investors? Sign up to our free newsletter today!


