MCD Elliott Wave technical analysis
Function: Trend.
Mode: Motive.
Structure: Impulsive.
Position: Intermediate wave (2).
Direction: Completion of wave C of (2).
Details: We have broken previous ATH at 300$, and we found resistance on the TL3. We are now looking for a pullback to then resume higher.
MCD Elliott Wave technical analysis – Daily chart
Our analysis reveals a trend function characterized by a motive mode, presenting an impulsive structure. Positioned in Intermediate wave (2), we anticipate the completion of wave C of (2). Notably, we’ve surpassed the previous all-time high (ATH) at $300 and encountered resistance on the TL3. Our focus now shifts to a potential pullback before resuming the upward trajectory.
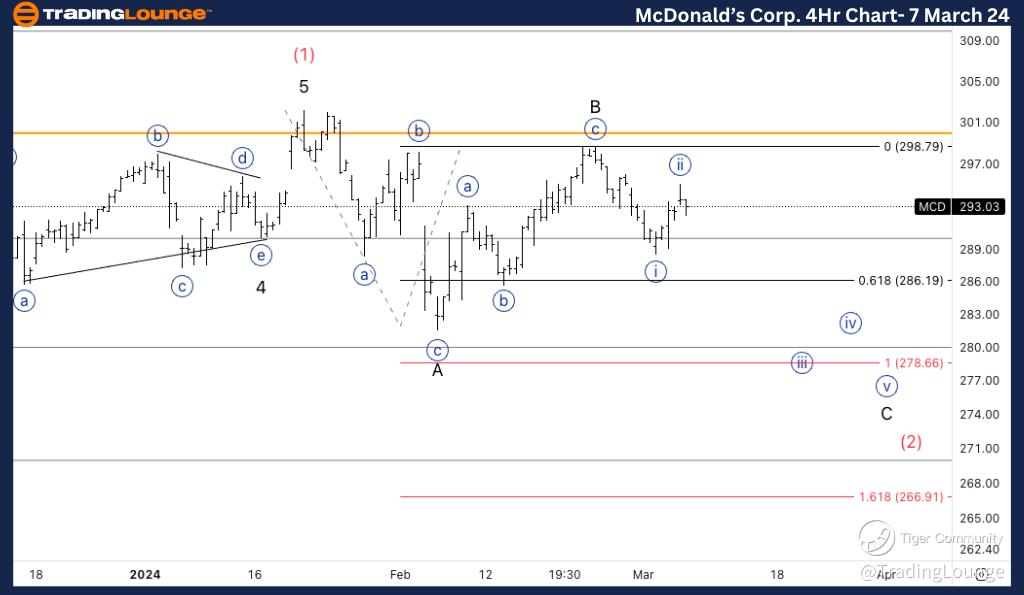
MCD Elliott Wave technical analysis
Function: Counter Trend.
Mode: Corrective.
Structure: Flat.
Position: Wave {ii} of C.
Direction: Acceleration lower into wave {iii}.
Details: Looking for acceleration lower into wave {iii}, if not we could still be in the making of a sideways wave B. Equality of C vs. A stands slightly below 278$, which is many time wave C target.
Welcome to our MCD Elliott Wave Analysis Trading Lounge, your premier destination for comprehensive insights into McDonald’s Corp. (MCD) using Elliott Wave Technical Analysis. Let’s explore the market dynamics as of the Daily Chart on 7 March 24.
MCD Elliott Wave technical analysis – Four chart
Here, we identify a counter trend function marked by a corrective mode, exhibiting a flat structure. Positioned in Wave {ii} of C, our attention is on the acceleration lower into wave {iii}. Should this scenario not materialize, we could still be in the process of forming a sideways wave B. It’s worth noting that the equality of C vs. A targets slightly below $278, aligning with the typical wave C target.