
JPMorgan Chase & Co. (JPM) is an American multinational investment bank and financial services holding company headquartered in New York City and incorporated in Delaware. As of December 31, 2021, JPMorgan Chase is the largest bank in the United States, the world’s largest bank by market capitalization, and the fifth-largest bank in the world in terms of total assets, with total assets totaling to US$3.831 trillion.
JPM daily chart June 2023
In June 2023 update, we showed a cycle ended as wave ((2)) near to a blue box at 101.22. Then, we can see how price action built 5 waves higher to end the leading diagonal at $144.34 as wave 1. Then, it developed a flat correction 3-3-5, where wave ((c)) was a clear ending diagonal to finish wave 2 at $123.11. After this, the market continued to the upside and we called that the stock should continue with this trend until completing another impulse as wave ((i)) before seeing 3, 7 or 11 swings correction as wave ((ii)).
JPM daily chart October 2023
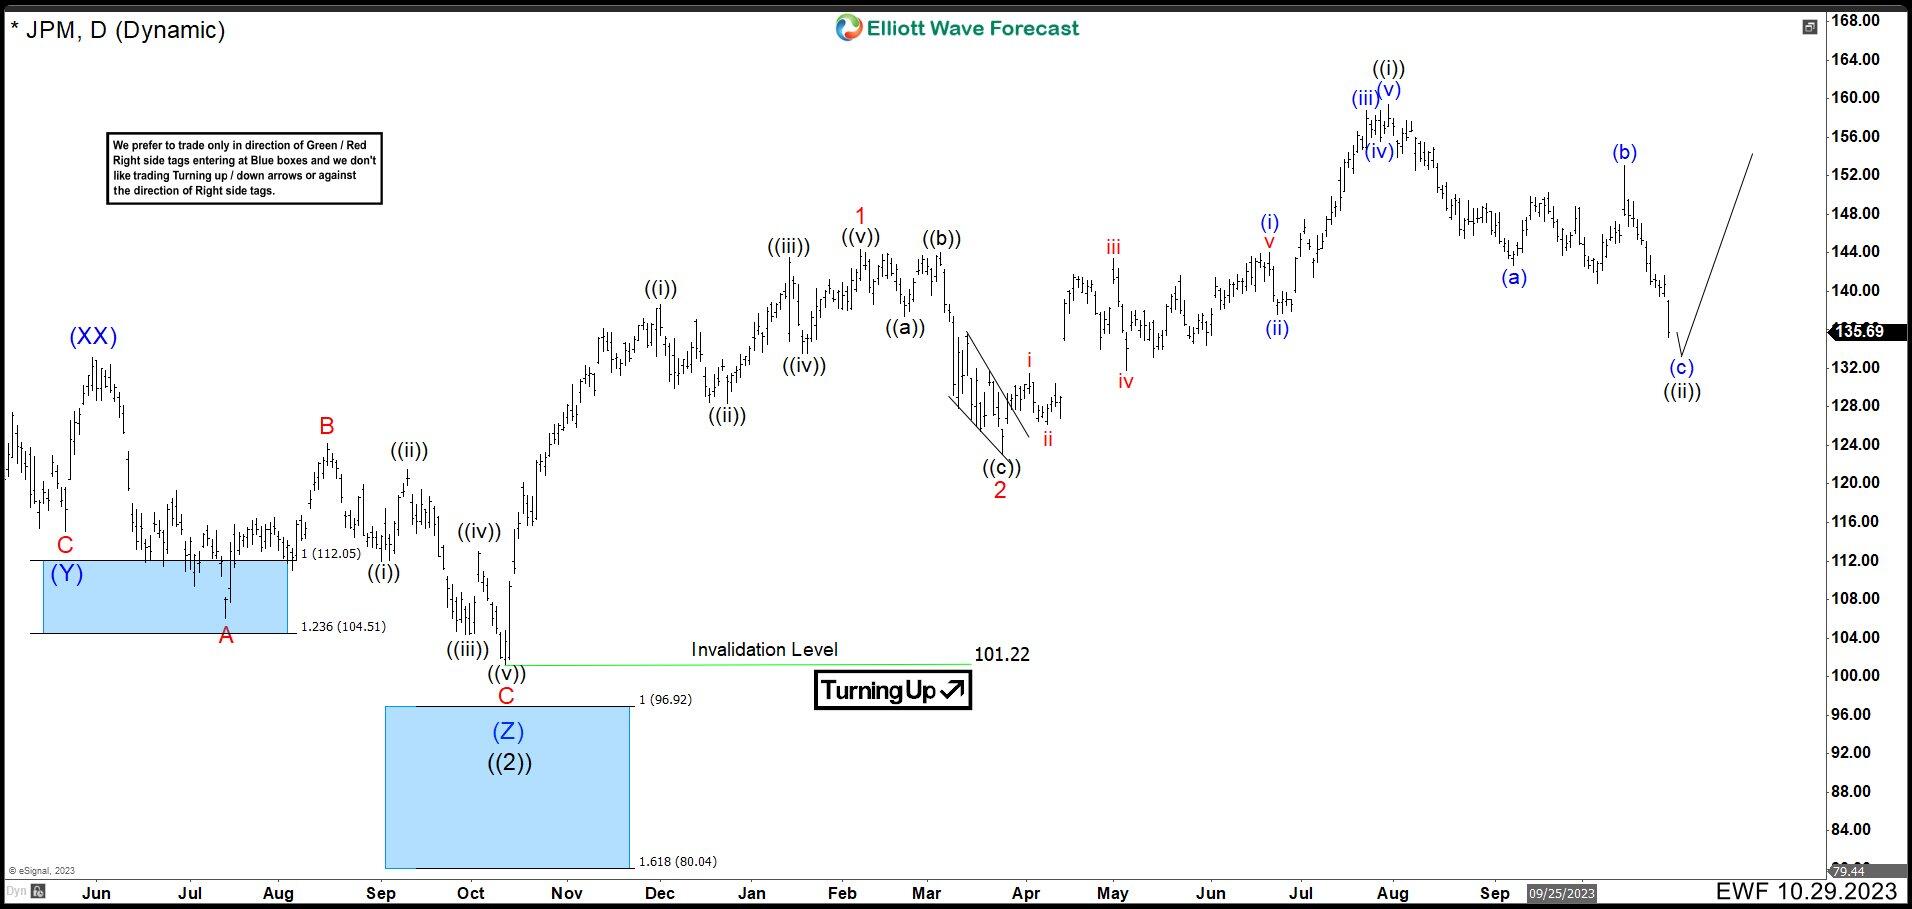
In October 2023, the market continued higher as expected and it ended wave ((i)) at 159.38. Then, the price action developed clearly 3 swings lower where wave (b) was a flat correction and it should keep dropping to 134.59 – 130.20 area to end wave ((ii)) before turning higher again.
JPM daily chart February 2024
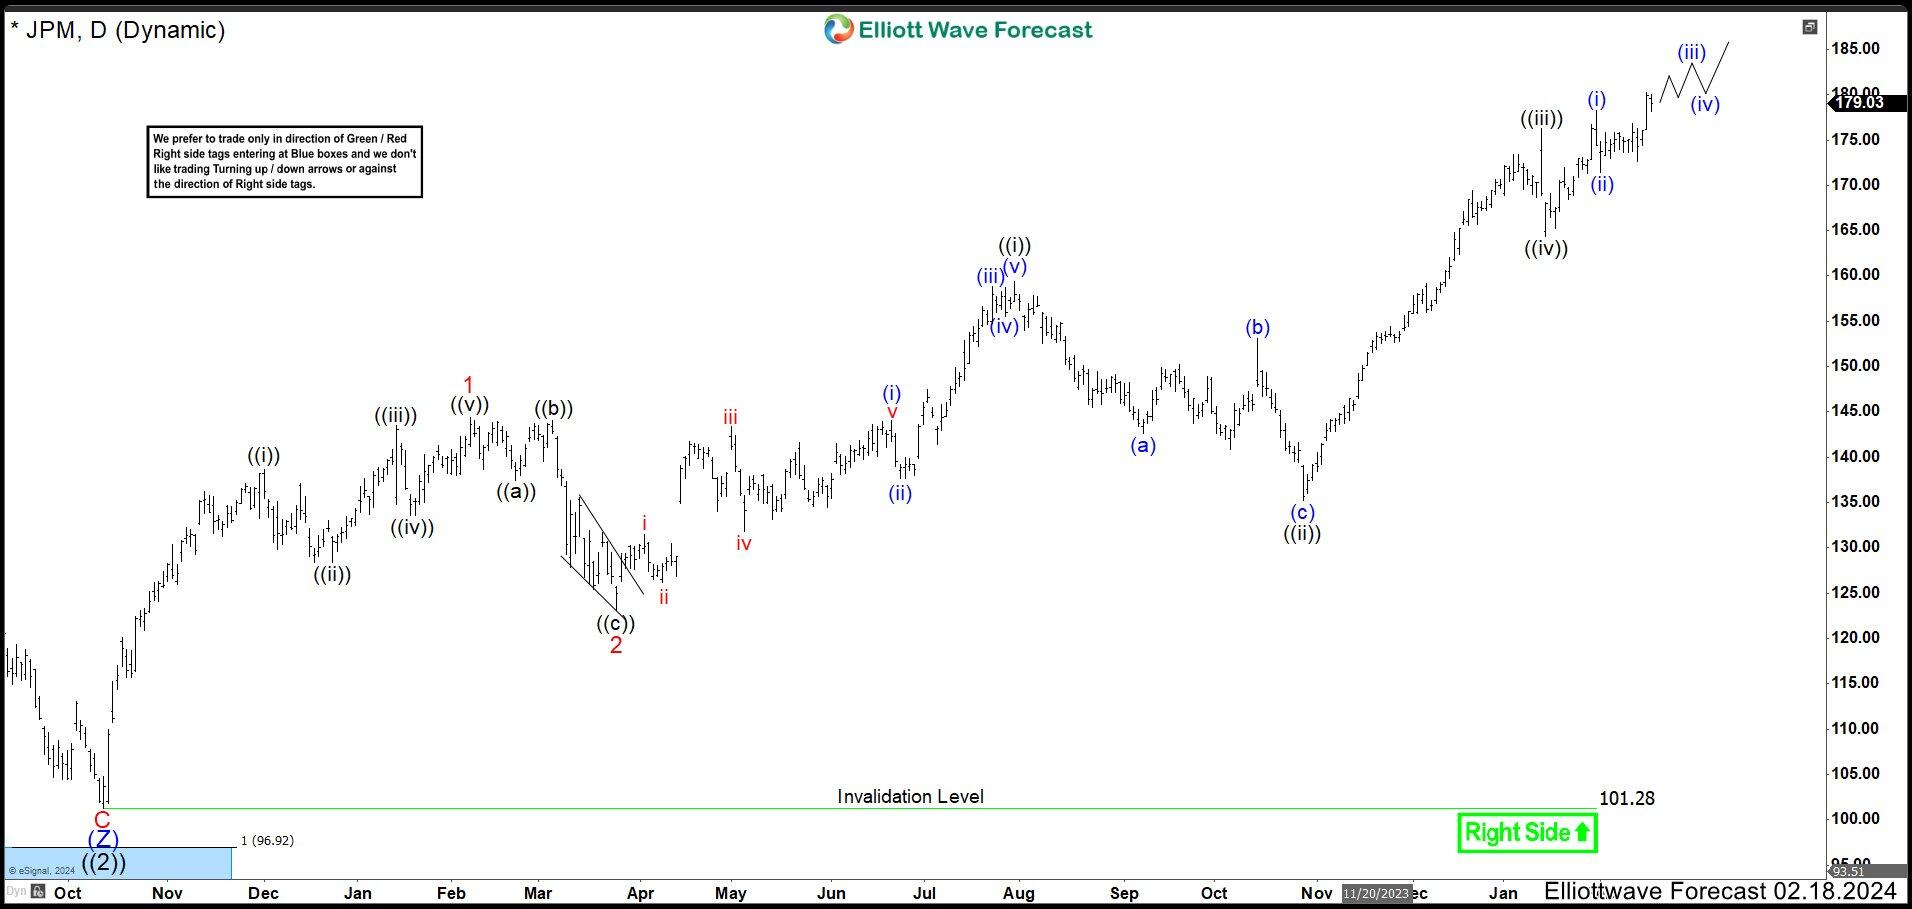
Actually, the wave ((ii)) ended at 135.19 missing the minimum target of 134.59 for 60 cents. JPM rallied stronger continued with the impulse structure. Wave ((iii)) completed at 176.31 high and pullback as wave ((iv)) ended at 164.30 low. As price action stays above this level, we are looking for more upside to complete wave ((v)). This wave ((v)) also will end wave 3 and the stock should enter in a wave 4 correction. The wave 4 could retest around 164.30 low and then continuing with the rally.


