GBP/USD, “Great Britain Pound vs US Dollar”
GBP/USD is testing the resistance level. The instrument is going above the Ichimoku Cloud, which suggests an uptrend. A test of the Kijun-Sen line at 1.2670 is expected, followed by a rise to 1.2785. An additional signal confirming the rise might be a rebound from the lower boundary of the bullish channel. The scenario can be cancelled by a breakout of the lower boundary of the Cloud with the price finding a foothold under 1.2615, which will mean a further decline to 1.2525.
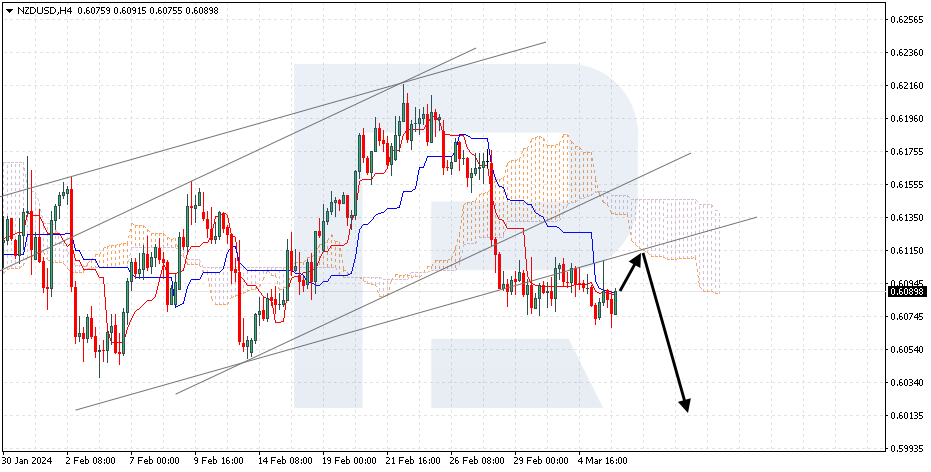
NZD/USD, “New Zealand Dollar vs US Dollar”
NZD/USD is rebounding from the support line. The instrument is going below the Ichimoku Cloud, which suggests a downtrend. A test of the lower boundary of the Cloud at 0.6110 is expected, followed by a decline to 0.6015. An additional signal confirming the decline could be a rebound from the lower boundary of the bullish channel. The scenario could be cancelled by a breakout of the upper boundary of the Cloud with the price finding a foothold above 0.6165, which will mean further growth to 0.6255.
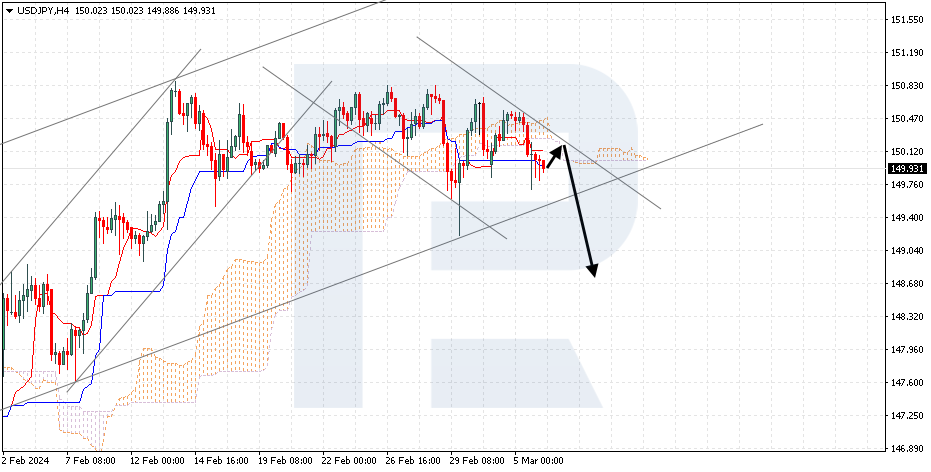
USD/JPY, “US Dollar vs Japanese Yen”
USD/JPY is declining within a Double Top reversal pattern. The instrument is going below the Ichimoku Cloud, which suggests a downtrend. A test of the lower boundary of the Cloud at 150.15 is expected, followed by a decline to 148.65. An additional signal confirming the decline could be a rebound from the upper boundary of the descending channel. The scenario can be cancelled by a breakout of the upper boundary of the Cloud with the price finding a foothold above 150.45, which will mean further growth to 151.35. Meanwhile, the decline could be confirmed by a breakout of the lower boundary of the bullish channel with the price finding a foothold under 149.25.