
- Bitcoin price could rise 5% to the $50,000 milestone if investors keep their profit appetite in check.
- Ethereum price could provide a buying opportunity before a 10% climb to retake the $2,717 range high.
- Ripple price could fall 8% to $0.4734 support floor amid a pending sell signal on the XRP/USDT daily chart.
Bitcoin (BTC) price’s upside potential is under threat as investor appetite for profit-taking continues to grow. Ethereum (ETH) price is also teasing a correction, while Ripple (XRP) price remains mired in quicksand.
Week Ahead: Bitcoin inches closer to $50,000, altcoins likely to explode
Bitcoin (BTC) price is eyeing the $50,000 psychological level. However, this 5% target to the north is under threat as BTC is already overbought, based on the Relative Strength Index (RSI) hovering above the 70 level.
Nevertheless, optimism abounds with technical indicators leaning in favor of the upside. The region between $40,643 and the 50-day Simple Moving Average (SMA) at $43,351 provides a strong support base with multiple buyer congestion levels therein.
The Moving Average Convergence Divergence (MACD) is also moving above its signal line as its histogram bars flashing green. This hints at a possible bullish cycle.
BTC/USDT 1-day chart
Conversely, if profit booking takes precedence, Bitcoin price could drop, falling back into the supply zone between $44,300 and $46,760. A break and close below the midline of this order block would set the tone for an extension south.
Also Read: Overbought studies suggest that limited correction would precede fresh push higher
Ethereum (ETH) price could rally 10% to retake the $2,717 range high since bulls maintain a strong presence in the market. This is seen with the MACD above its signal line and its histogram bars in positive territory.
However, the Proof-of-Stake (PoS) token is likely to provide a buying opportunity before the next leg up. This can be seen with the RSI bending south, a sign of falling momentum. Notably, the bullish outlook would only be threatened if Ethereum price falls out of the ascending parallel channel, confirmed by a close below $2,388.

ETH/USDT 1-day chart
On the flip side, if selling pressure increases, Ethereum price could extend the fall to test the 50-day SMA at $2,368. If this level fails to hold, ETH could roll over, slipping below the ascending trendline to test the $2,280 support level, or worse, the 100-day SMA at $2,247.
Also Read: Ethereum price tops $2,400 as 25% of ETH supply is staked and ETF applicants amend filings
Ripple (XRP) continues to slump and could break below the midline of the channel in the eyes of a pending sell signal. This will be executed once the RSI crosses below its signal line (yellow band). If the bears have their way, XRP price could revisit the $0.4734 support floor.
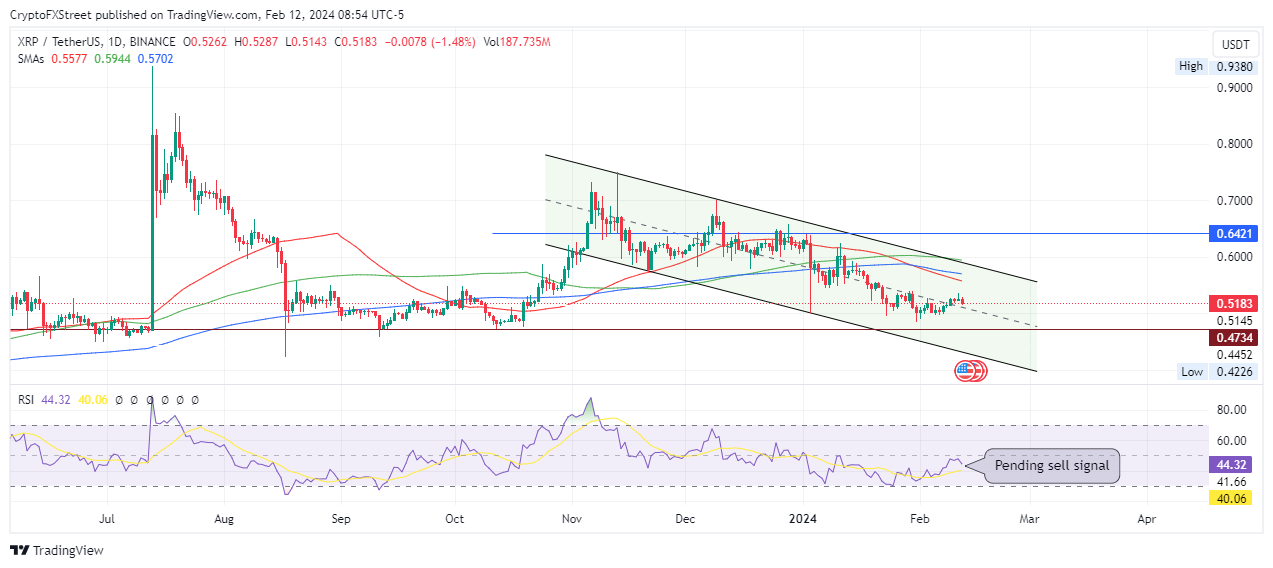
XRP/USDT 1-day chart
On the flipside, if buying pressure increases, Ripple price could push north, potentially escaping the bearish chart pattern by breaching the 100-day SMA at $0.5944. A break and close above $0.6421 would confirm the continuation of the uptrend.
Also Read: XRP price dips marginally amid progress in SEC v. Ripple lawsuit’s discovery phase


