In this technical article we’re going to take a look at the Elliott Wave charts charts of EURO STOXX (SX5E) Index published in members area of the website. Our members know we’ve presented many profitable long trading signals in different indices. $SX5E is one of them. EURO STOXX recently made a clear three-wave correction from its peak on March 14th. The pull back completed right within the Equal Legs zone (Blue Box – Buying Area). In this discussion, we’ll break down the Elliott Wave pattern and its trading setup.
EURO STOXX Elliott Wave one-hour chart 03.17.2024
EURO STOXX is showing bullish sequences within the cycle from the 4672.4 low, suggesting further strength ahead. Presently, the index is undergoing an intraday pullback (ii) in blue. The structure of this pullback remains incomplete, indicating short-term weakness towards the 4977.41-4948.7 area. We advise against selling $SX5E and instead favor the long side from the marked Blue Box (buying zone). Once $SX5E reaches our buying area, it should ideally either rally towards new highs or undergo a bounce in three waves alternatively. Once the bounce retraces 50% against the ‘b’ red, we will adjust our long positions to be risk-free by placing a stop loss at breakeven (BE).
Official trading strategy on How to trade 3, 7, or 11 swing and equal leg is explained in details in Educational Video, available for members viewing inside the membership area.
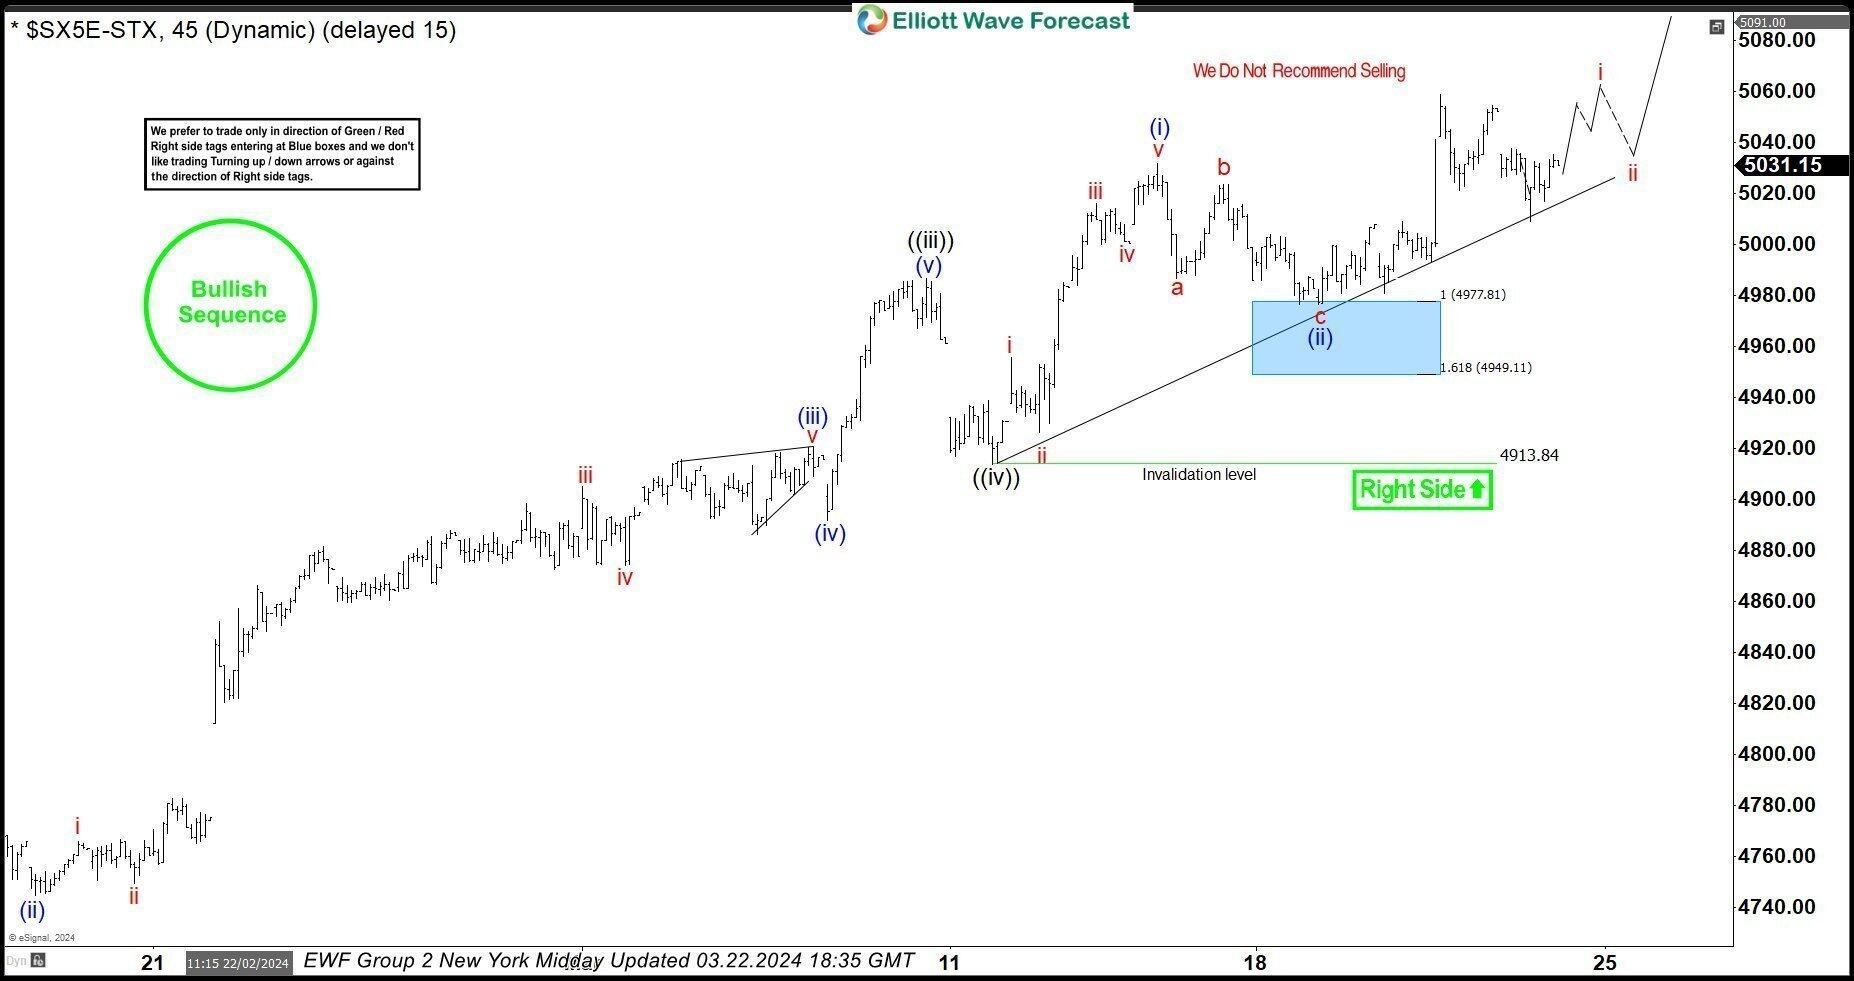
EURO STOXX Elliott Wave one-hour chart 03.17.2024
EURO STOXX hit our buying zone at the 4977.81-4949.1 area and found buyers as expected. The index has reacted strongly from the Blue Box Area, breaking out towards new highs and confirming the continuation of the next upward leg. Consequently, any existing long positions should now be risk-free. We maintain our bullish positions within the current trade, expecting the index to keep finding buyers in 3, 7, and 11 swing sequences.