- Ethereum price has declined 16% from its year-to-date peak of $4,093.92.
- The altcoin is currently trading sideways, below the $3,575 resistance level.
- Ethereum supply on exchanges climbed to the highest level in a year, increasing the likelihood of higher selling pressure on Ether.
Ethereum (ETH) price could be poised for a further correction in the short-term as the altcoin’s supply on exchanges, an indicator that provides clues over the selling pressure on an asset, has hit a one-year peak on Monday, according to on-chain data. Despite trading in a narrow range recently, the value of the second-largest cryptocurrency remains nearly 16% below its March 12 peak of $4,093.92.
Also read: Ethereum faces steep correction as whales opt for profit-taking
Ethereum reserves in exchange wallets climb to one-year peak
Supply on Exchanges gauges the volume of an asset that is held in exchange wallets. This is a key on-chain metric since a sudden increase in exchange reserves could be a precursor of a mass sell-off or a so-called capitulation event.
In the case of Ethereum, its supply on exchanges has increased consistently in teh last few weeks, hitting on Monday the highest level in the past year. This sudden rise in supply comes together with a decline in Ethereum price from its year-to-date peak of $4,093.92. This implies that the rising supply is likely contributing to the selling pressure on Ether.
Ethereum Supply on Exchanges. Source: Santiment
Meanwhile, Whale transactions valued at $100,000 and higher have declined since the altcoin hit its year-to-date peak. A spike in this metric gauging transactions from large-wallet investors can be both bullish or bearish for the asset’s price, depending mostly on the context. Since the current transaction spike coincides with price decline, it means whales are likely selling to take profits.
After consistent profit-taking since mid-February, there seems to be a slowdown, the chart below shows.
On March 19, 20 and 21, the spike in whale transactions coincided with profit-taking spikes on the Network Realized Profit/Loss metric. This indicator computes a daily network-level return on assets ratebased on the coin’s on-chain transaction volume. Strong spikes in the Network Realized Profit/Loss metric indicate that holders are (on average) selling their bags at a significant profit.
%20%5B15.20.31,%2025%20Mar,%202024%5D-638469671352063914.png)
Whale transactions valued at $100,000 and higher, Network Realized Profit/Loss. Source: Santiment
Ethereum price could decline to $3,000
Ethereum price is currently in a downward trend, forming lower highs and lower lows since the altcoin hit its year-to-date peak of $4,093.92 on March 12. ETH price is currently below resistance at $3,575.24, the 50% Fibonacci retracement level of the decline from the year-to-date peak on March 12 to March 20 low of $3,056.56.
The Moving Average Convergence/ Divergence indicator’s red bars below the zero line signal negative momentum, supporting the bearish thesis for Ethereum’s price. If selling pressure continues, ETH price could dip to the psychological support level at $3,000 and the Fair Value Gap (FVG) between $3,007 and $3,036.
Once Ethereum collects liquidity below this level, ETH price could rebound to the year-to-date peak of $4,093.92, which coincides with the resistance level on the weekly price chart.
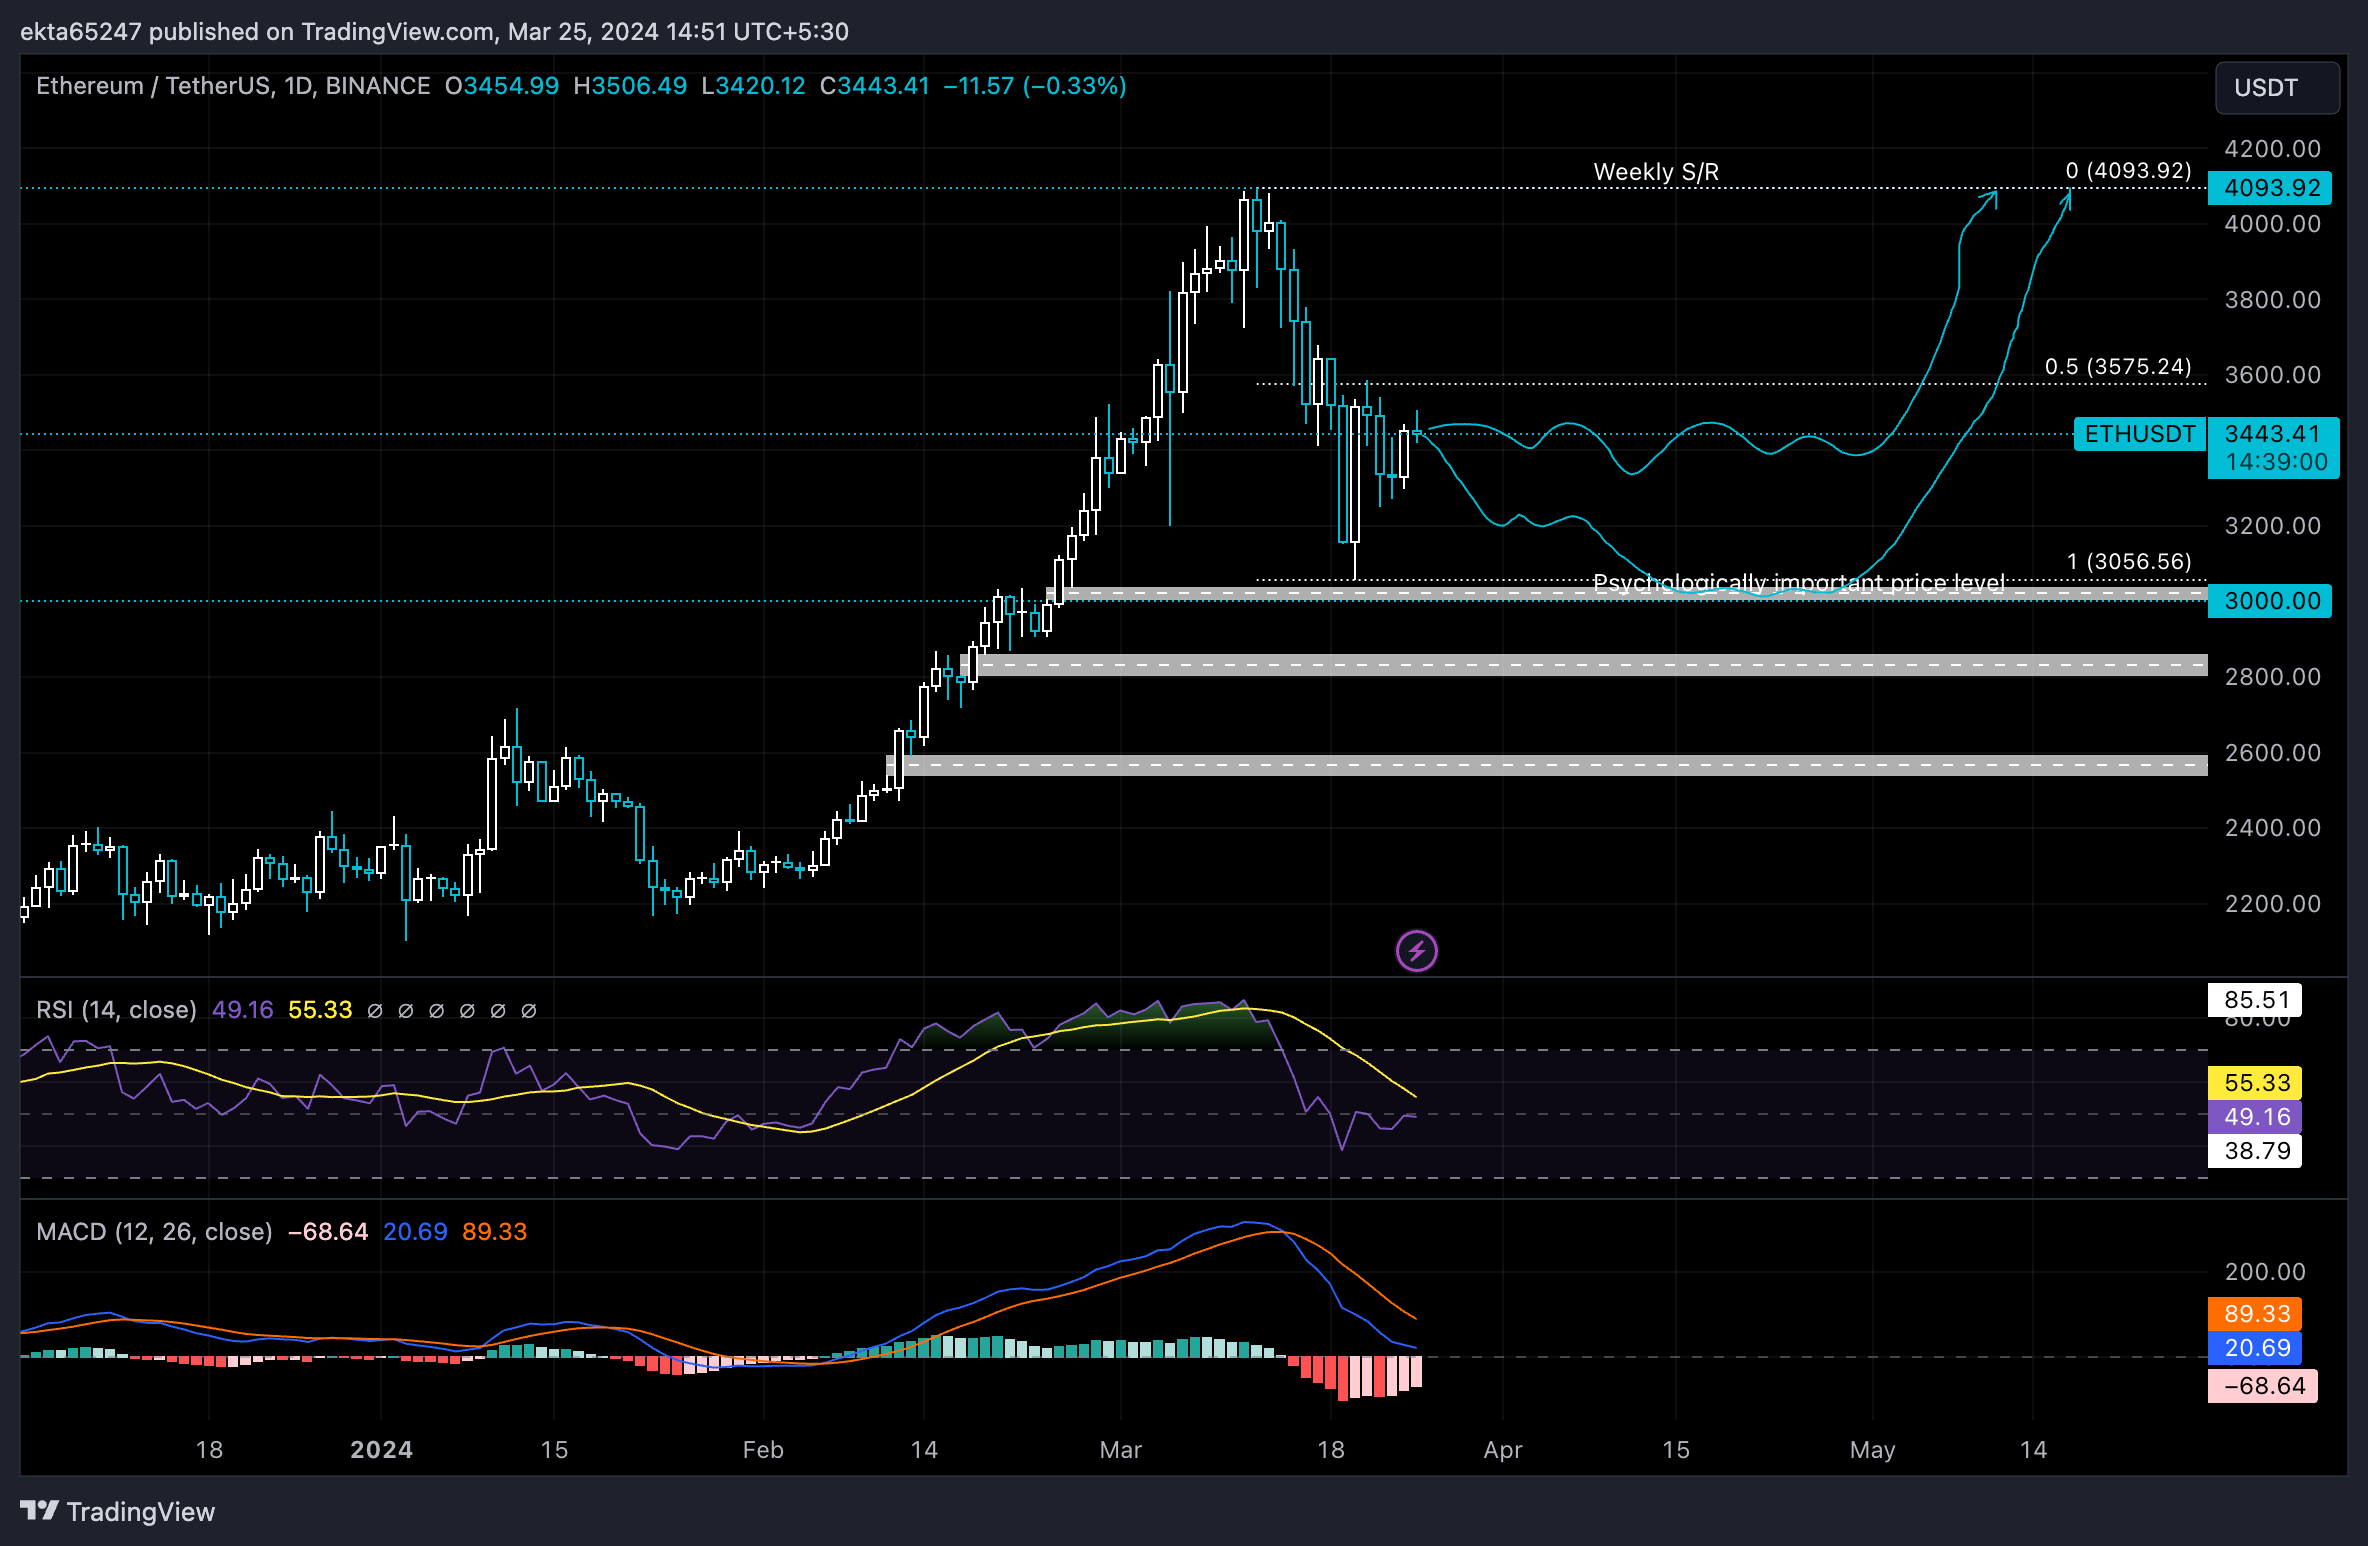
ETH/USDT 1-day chart
However, the negative outlook would be invalidated if prices post a daily candlestick close above $3,575. In an upside scenario, ETH price faces resistance at key levels of $3,500 and $4,000, prior to the year-to-date peak of $4,093.92.