
- Bitcoin price continues its consolidation inside the $41-43,000 range for more than a week.
- Ethereum price is likely to slide lower, allowing sidelined buyers an opportunity to accumulate ETH around $2,167.
- Ripple price needs another sweep before it can kickstart an ascent to $0.532.
Bitcoin (BTC) price shows no directional bias whatsoever as it trades inside a tight range. Investors, however, are looking at Ethereum (ETH), Ripple (XRP) and other altcoins for volatility.
Bitcoin price squeezes
Bitcoin price action over the past week shows that volatility is nowhere to be found. As BTC trades inside a $41-43,000 range, investors are anticipating a move in either direction. Some forecast that a crash to $34,000 needs to occur before the pioneer crypto rallies higher. Others are playing a contrarian approach, expecting BTC to continue its uptrend as it breaches the tightening range.
Regardless of what direction Bitcoin price goes after its breakout, this analysis will focus on a smaller time frame outlook. The key levels that investors need to be watching are
- Monday’s high at $43,567
- Monday’s low at $42,229 and
- Previous Monday’s low at $41,167.
Using a range-bound trading strategy, if price sweeps liquidity above/below one of these points it will suggest it is about to move back within the range toward the lower or upper bound, continuing an extension of the ranging market.
From the looks of the ongoing consolidation, the chances of an upward move to the $43,567 level first appears high, which would then likely be followed by a sweep of $41,167.
BTC/USDT 1-hour chart
On the other hand, if Bitcoin price sweeps the $41,167 support level first, it would allow investors to open a long position targeting $43,567.
Ethereum price wants to move higher
Ethereum price trades inside the $2,167 to $2,719 range and is targeting a retest of the resistance zone, extending from $2,400 to $2,600. But considering the Relative Strength Index’s (RSI) position, a sweep of the $2,167 level first looks likely.
A sweep followed by a quick recovery will be a key buy signal for sidelined buyers. This move is likely going to result in a retest of the range’s midpoint at $2,443.
In some cases, Ethereum price might extend higher if the buying pressure ratchets up.
Also read: Over 50% of Ethereum’s ERC-20 tokens listed on DEXes show characteristics of pump and dump
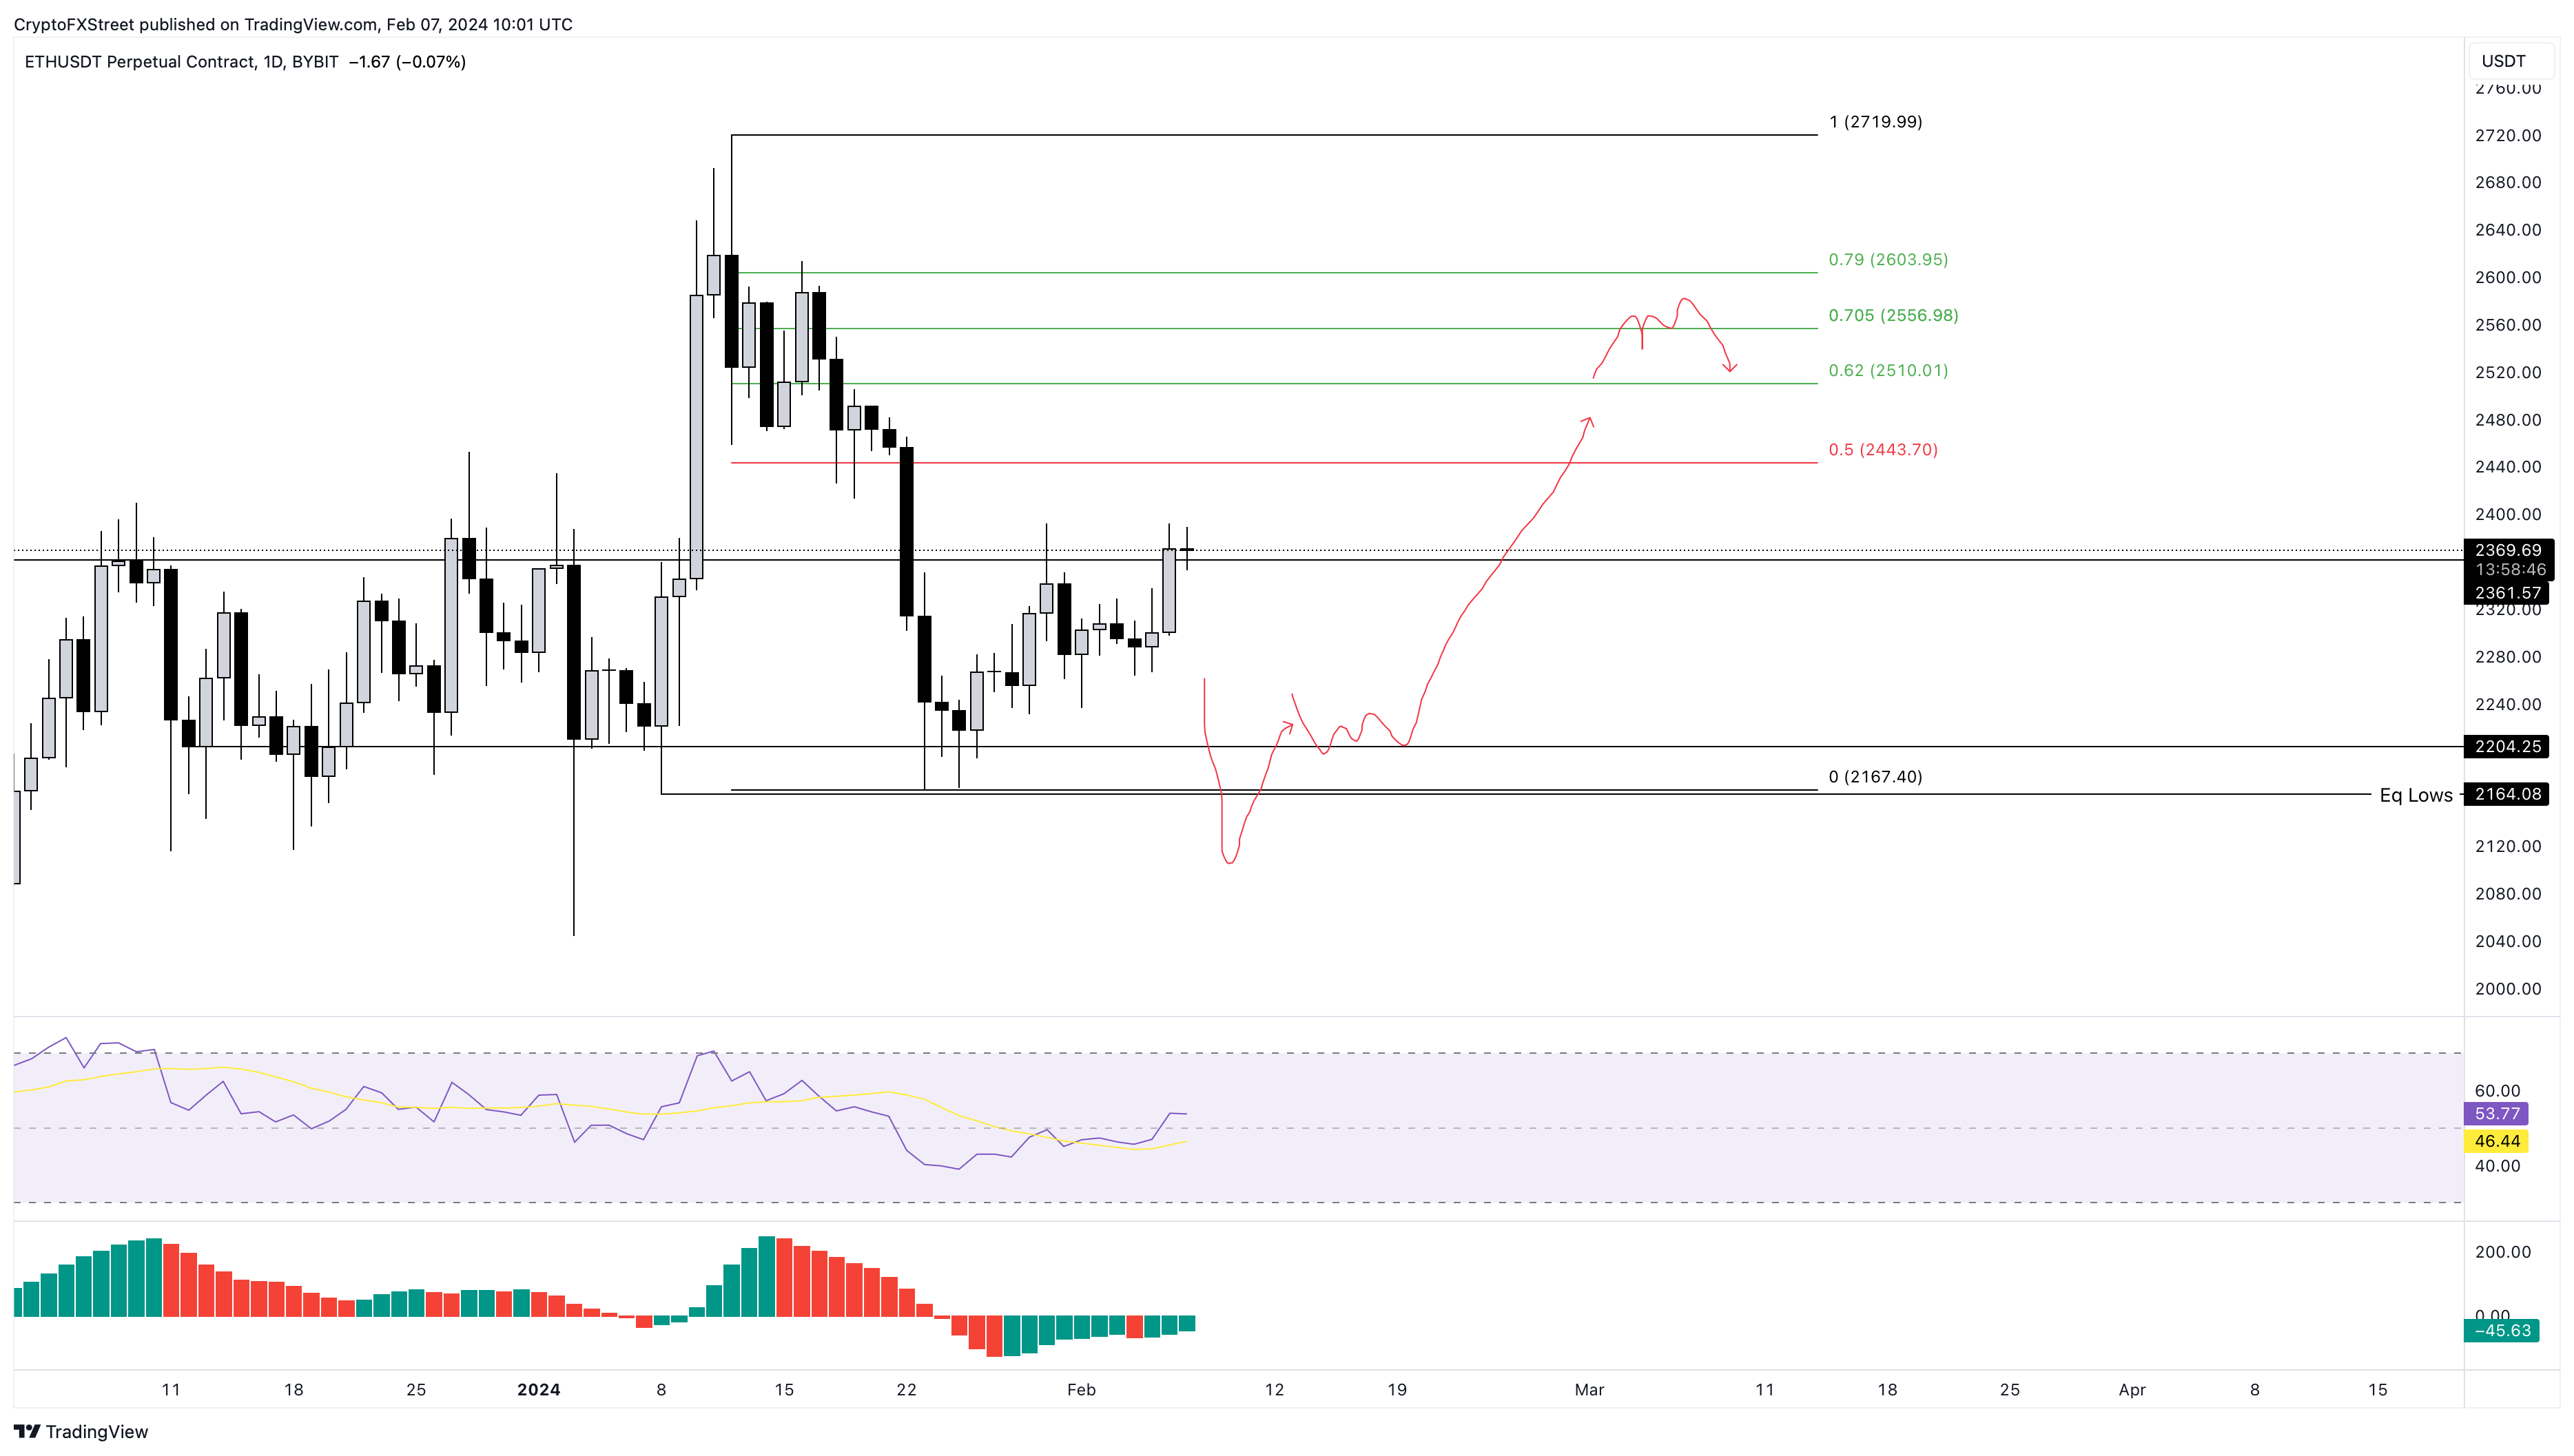
ETH/USDT 1-day chart
Regardless, if Ethereum price breaches $2,167, it will invalidate the bullish thesis by producing a lower low. In such a case, ETH could revisit $2,000 and lower levels.
Ripple price at the end of its downtrend
Ripple price shows that it is approaching a potential bottom on the three-day chart. Investors should expect a potential sweep of the $0.468 support level before an uptrend kickstarts.
If this liquidity run is followed by a quick recovery off the aforementioned level, it will be a buy signal. In such a case, investors can expect XRP to eye a 13% rally to retest the weekly barrier at $0.532.
Also read: XRP price could deteriorate with Ripple’s request for deadline extension in SEC lawsuit
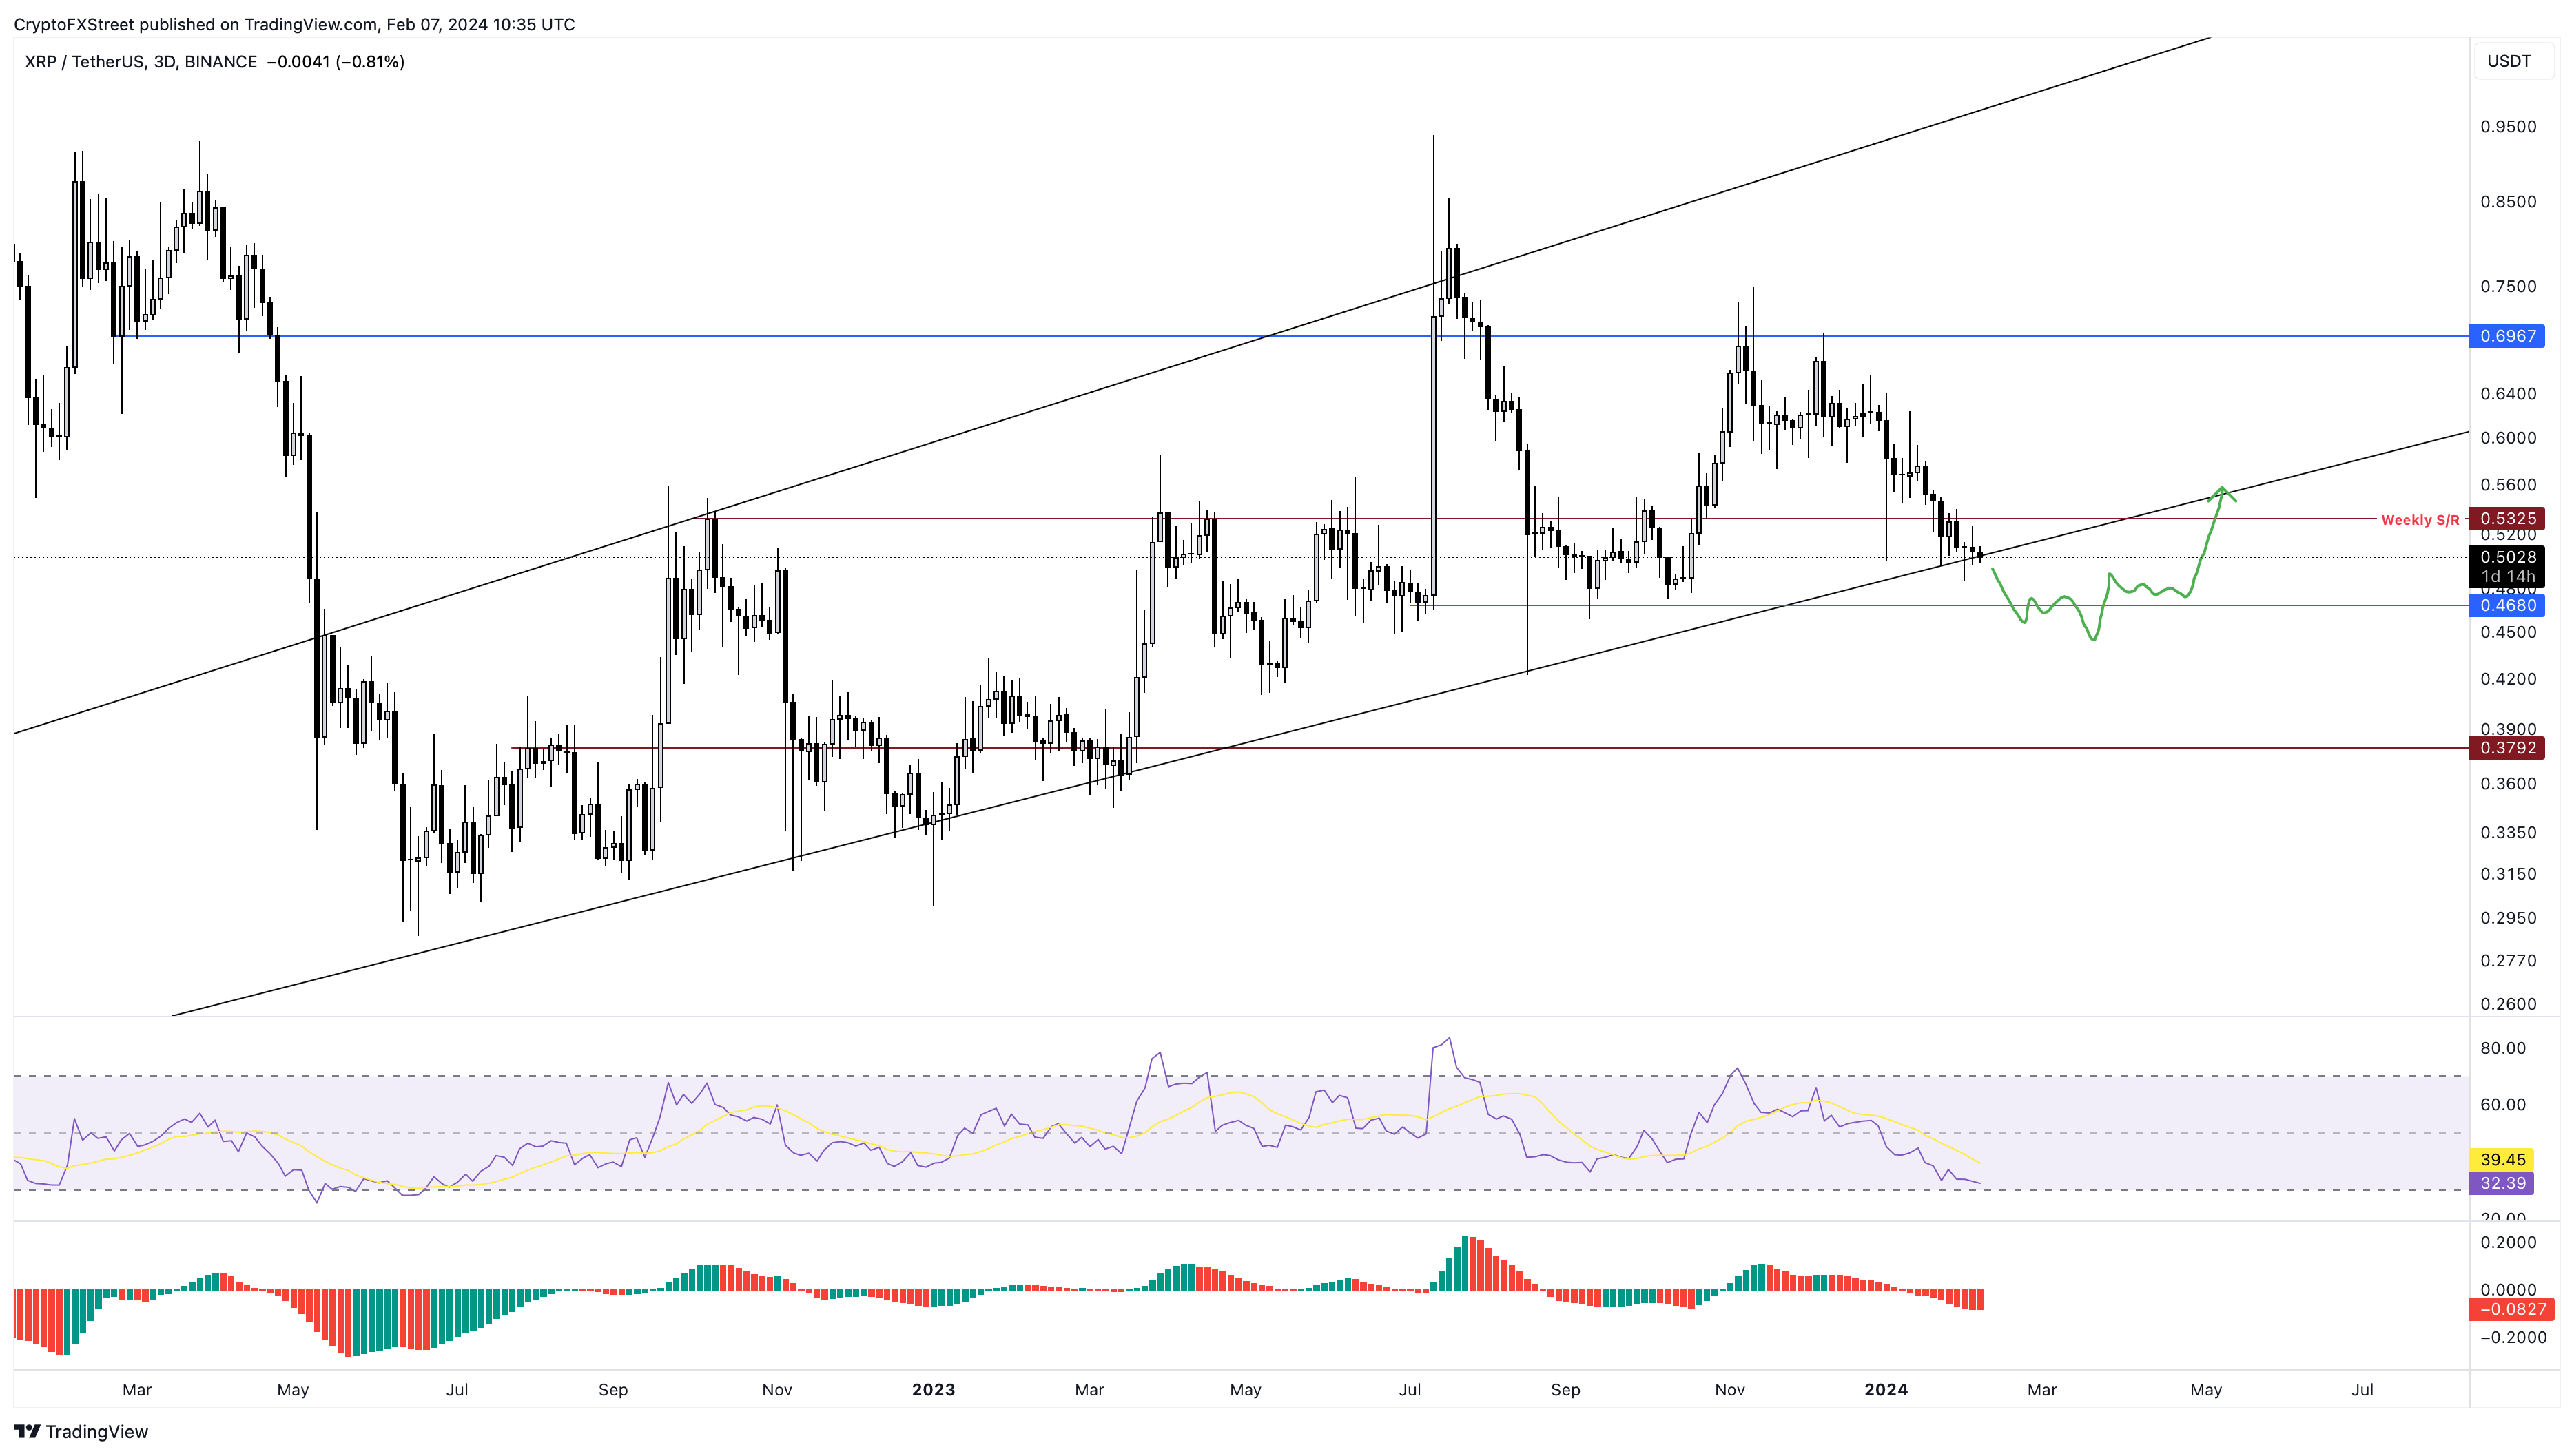
XRP/USDT 3-day chart
While the outlook for Ripple price is logical, a break below and then flipping of the $0.468 support level from the Autumn 2023 lows, into a resistance level will invalidate the bullish thesis. In such a case, XRP could nosedive 19% and tag the next key support level at $0.379.


