COST Elliott Wave technical analysis
Function: Trend.
Mode: Motive.
Structure: Impulsive.
Position: Minor wave 3.
Direction: Completion of wave 3 towards TL 8 or TL1.
Details: We are looking at upside in Costco as we seem to be extending higher with increasing momentum suggesting the trend is not getting weaker, and therefore next target is TL8 at 800$.
COST Elliott Wave technical analysis – Daily chart
In our analysis, we observe a trend function characterized by a motive mode, showcasing an impulsive structure. Positioned in Minor wave 3, our focus is on the completion of wave 3, targeting either TL 8 or TL1. Notably, Costco’s upward momentum is gaining strength, indicating that the trend remains robust. Our next target is TL8 at $800, reflecting the continued bullish sentiment.
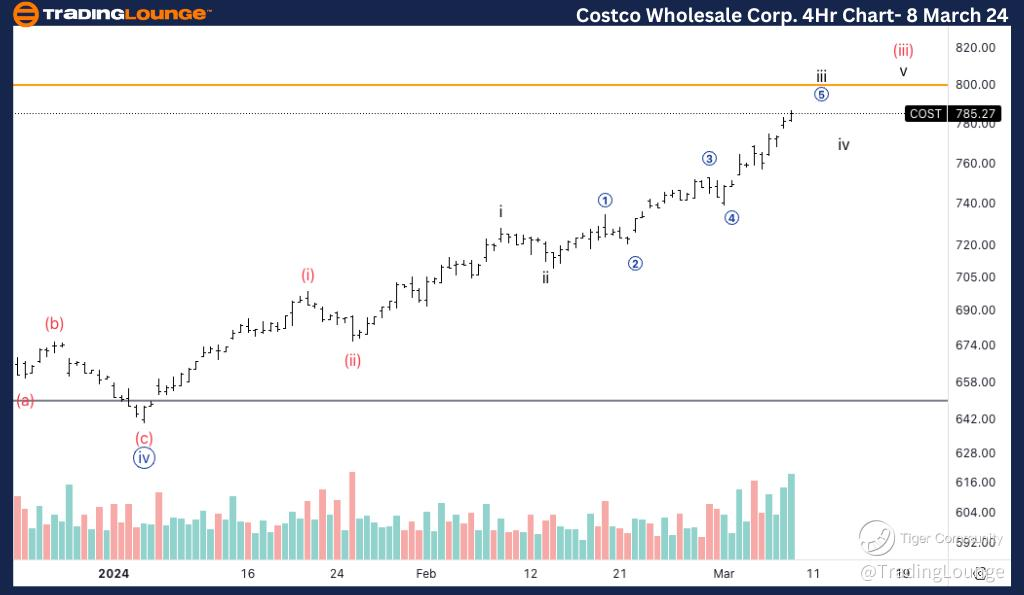
COST Elliott Wave technical analysis
Function: Trend
Mode: Motive
Structure: Impulsive
Position: Wave iii of (iii).
Direction: Top into wave iii.
Details: This increase in volume suggests we could be getting close to some sort of a top and we know the number 8 is a profit taking number, so being at 780$ towards TL8 this could be explained. Looking for additional upside after the pullback.
COST Elliott Wave technical analysis – Four hour chart
Here, we identify a trend function marked by a motive mode, presenting an impulsive structure. Positioned in Wave iii of (iii), we anticipate reaching a top in wave iii. The surge in volume suggests that we may be nearing a potential top, particularly as the price approaches $780 towards TL8. This aligns with the phenomenon of profit-taking around significant levels, such as the number 8. Despite the expected pullback, we anticipate further upside movement in the future.