

- The daily RSI remains in positive territory but took a big hit.
- The hourly chart shows strong selling pressure with RSI sitting in oversold territory.
- The pair may consolidate in the short term.
The AUD/USD pair is currently trading at 0.6583, suggesting a noticeable and strong downturn. Regardless of the immediate selling pressure, the broad technical outlook indicates that buyers maintain significant control over the pair. The hourly chart shows strengthening short-term bearish momentum but the selling traction may lose steam after indicators enter in oversold territory.
On the daily chart, the Relative Strength Index (RSI), despite a slight decline, is still in the positive range. The green bars in the Moving Average Convergence Divergence (MACD) show a stable positive momentum, further confirming the dominance of buyers on the larger timeframes.
AUD/USD daily chart
While the daily chart displays evidence of buying momentum, the latest RSI readings on the hourly chart present a contrasting picture with values well below 30. This implies that the AUD/USD is in oversold territory, suggesting an overwhelming dominance of sellers in the market. However, the MACD shows decreasing red bars, indicating a waning bearish momentum in the short term as the sellers might be running out of gas.
AUD/USD hourly chart
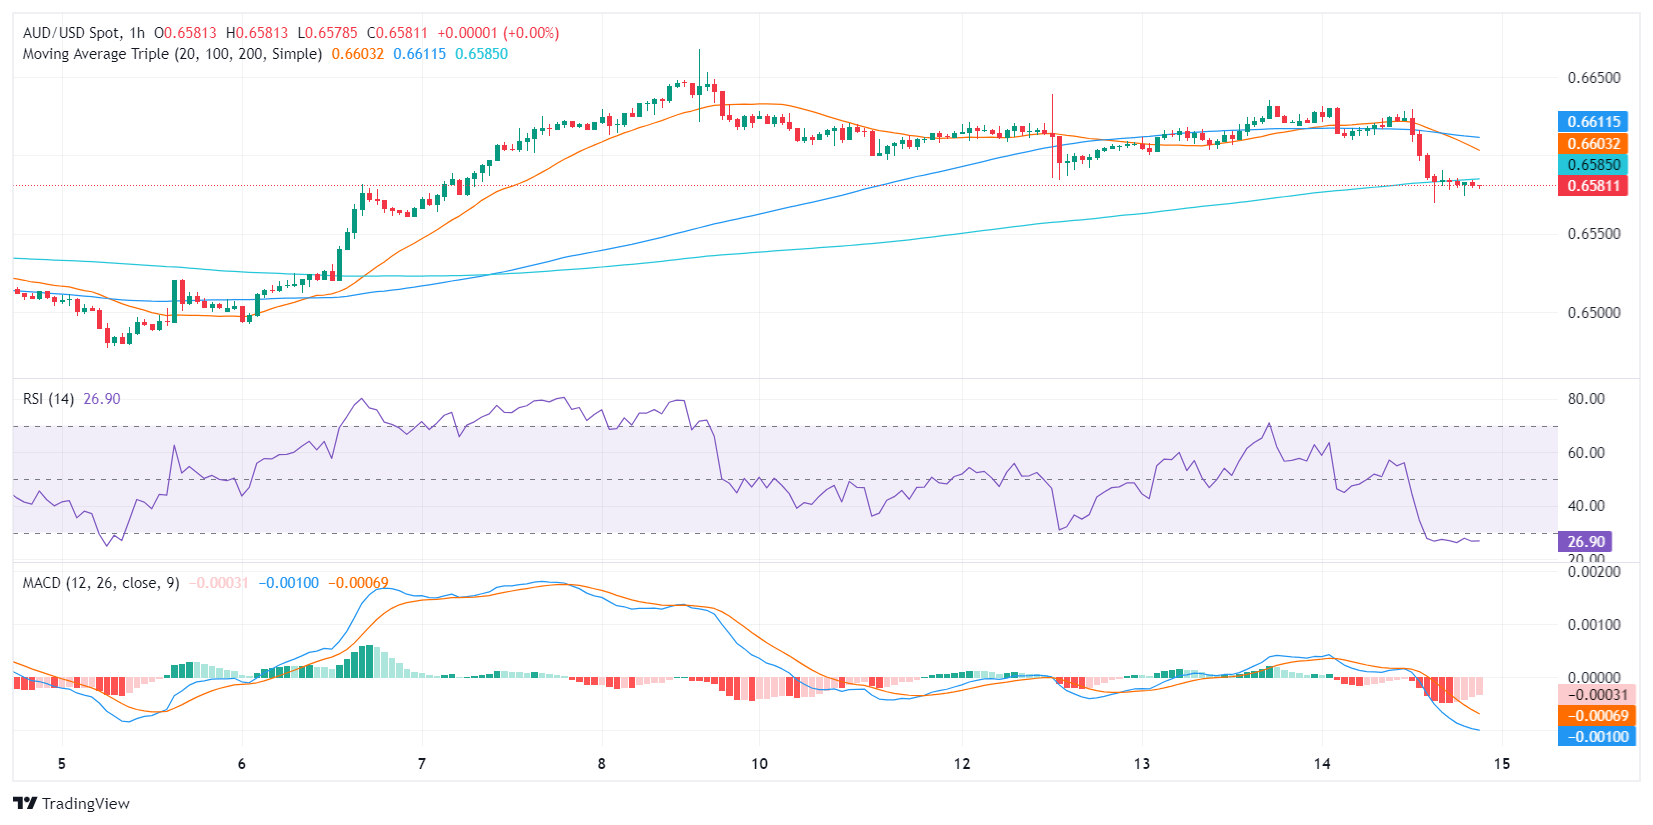
Despite the bearish momentum on the hourly chart, the broader outlook remains bullish as the pair continues to trend above the 100 and 200-day SMAs. As for now, the buyers are battling to defend the 20-day average, which in case of losing, will tilt the outlook in favor of the bears for the short term.