![Coca-Cola Company Elliott Wave technical analysis [Video]](https://biedexmarkets.com/wp-content/uploads/2024/03/Coca-Cola-Company-Elliott-Wave-technical-analysis-Video.jpg)
KO Elliott Wave technical analysis
Function: Trend
Mode: Motive
Structure: Impulsive
Position: Minor wave 2 of (3).
Direction: Completion of wave {c} of 2.
Details: Looking for support to be found on top of 60$, as we seem to have resumed from the 50$ low in an impulsive manner and we have yet to confirm th count, breaking previous wave (X) at Medium Level 65$.
KO Elliott Wave technical analysis – Daily chart
Our analysis reveals a trend function with a motive mode, characterized by an impulsive structure. Positioned in Minor wave 2 of (3), we anticipate the completion of wave {c} of 2. Our focus lies on finding support above $60, following the resumption from the $50 low in an impulsive manner. Confirmation of this count entails breaking the previous wave (X) at Medium Level $65.
KO day chart
KO Elliott Wave technical analysis
Function: Counter Trend
Mode: Corrective
Structure: Flat
Position: Wave {c} of 2.
Direction: Completion of wave {c} of 2.
Details: Looking for a bottom in wave {c}, we have hit equality of {c} vs. {a} at 59.5$, looking to reach demand zone at 58$ to then expect a turn higher.
Welcome to our KO Elliott Wave Analysis Trading Lounge, your go-to destination for in-depth insights into The Coca-Cola Company (KO) using Elliott Wave Technical Analysis. Let’s delve into the market dynamics as of the Daily Chart on 6 March 24
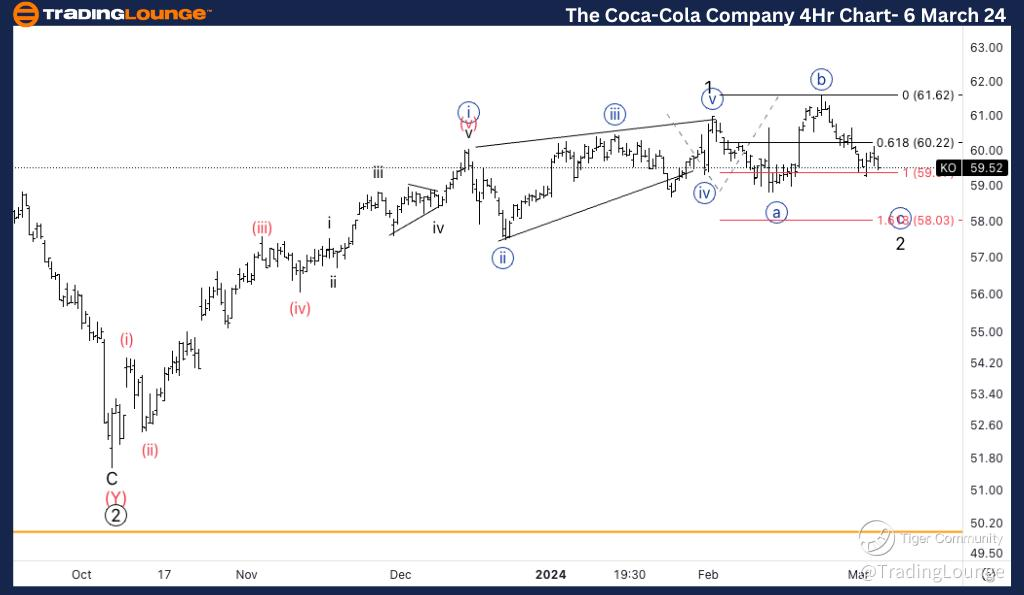
KO Elliott Wave technical analysis – Four hour chart
Here, we identify a counter trend function with a corrective mode, marked by a flat structure. Positioned in Wave {c} of 2, we anticipate the completion of wave {c} of 2. Our attention is directed towards identifying a bottom in wave {c}, with equality observed between {c} and {a} at $59.5. We anticipate reaching the demand zone at $58, followed by an upward reversal.
KO four hour chart