Oil has recently given us good buying opportunity. In this technical article we’re going to look at the Elliott Wave charts of Oil published in members area of the website. The commodity shows bullish sequences in the cycle from the 67.75 low. Consequently, we have been favoring the long side and recommended members to keep buying the dips in 3,7,11 swings. Oil made clear 3 waves down from the March 1st peak and completed correction right at the Equal Legs zone ( Blue Box Area) . In further text we’re going to explain the Elliott Wave pattern and trading setup.
Oil Elliott Wave one-hour chart 03.09.2024
Current view suggests that wave (x) pull back is still in progress , calling for more short term weakness toward 77.37-76.59 area. We don’t recommend selling Oil and prefer the long side from the marked Blue Box ( buying zone). As the main trend is bullish, we expect the price to make at least bounce in 3 waves from the Blue Box area. Once the bounce reaches 50 fibs against the x red connector we will take partial profits and make position risk free ( put SL at BE).
Quick reminder on how to trade our charts :
Red bearish stamp+ blue box = Selling Setup
Green bullish stamp+ blue box = Buying Setup
Charts with Black stamps are not tradable.
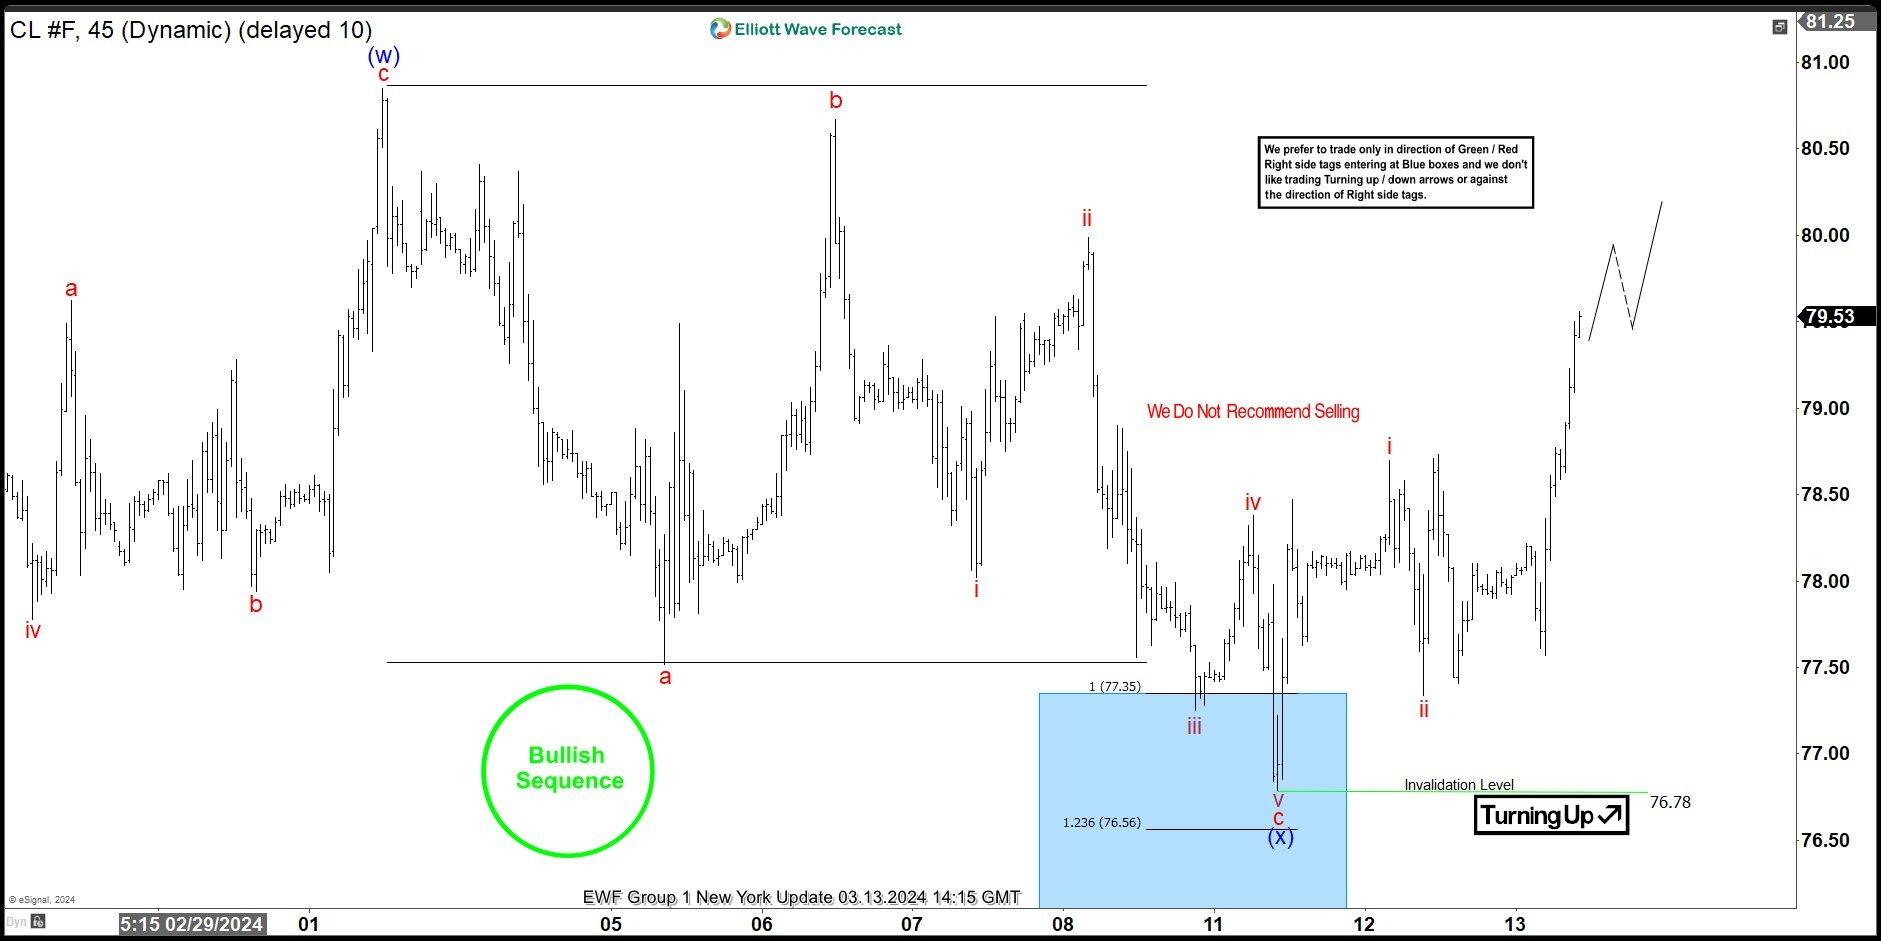
Oil Elliott Wave one-hour chart 03.13.2024
The commodity reached our buying zone at : 77.35-76.56 and found buyers as expected. Oil is giving us very good reaction from the Blue Box Area. We call pull back (x) blue completed at the 76.78 low. As a result, any long positions should be risk free by now. We would like to see break of (w) blue peak (March 1st) to confirm next leg up is in progress.