
- The daily chart analysis reveals consistent bullish sentiment with RSI nearing overbought conditions, indicating possible pullbacks.
- The AUD/JPY hourly chart paints a similar picture, with the RSI deep in overbought terrain.
- Even with a potential short-term bearish correction, the AUD/JPY standing above SMA shows an overall bullish trend.
In Wednesday’s session, AUD/JPY is experiencing an uptake, trading at 99.62, its highest level since 2014, and showing a gain of 1.15%. Although there are hints of a short-term consolidation incoming, any downward movements could be considered as a mere technical correction.
Based on the indicators of the daily chart for the AUD/JPY pair, a positive trend is seen, as indicated by the positive territory of the Relative Strength Index (RSI). The RSI is nearing the overbought territory, signaling that while the trend is bullish, an increasing risk of a pullback due to overbought conditions is also present. In agreement with this, the Moving Average Convergence Divergence (MACD) histogram also reveals a rising trend, indicated by green bars, corroborating the positive momentum.
Contrarily, on the hourly chart, the AUD/JPY pair shows a sharp move into the overbought territory, as indicated by the RSI of 78. This demonstrates that the pair might face a corrective pullback in the short term given these extreme over-extended conditions. The MACD histogram also confirms this, as it continues to print green bars.
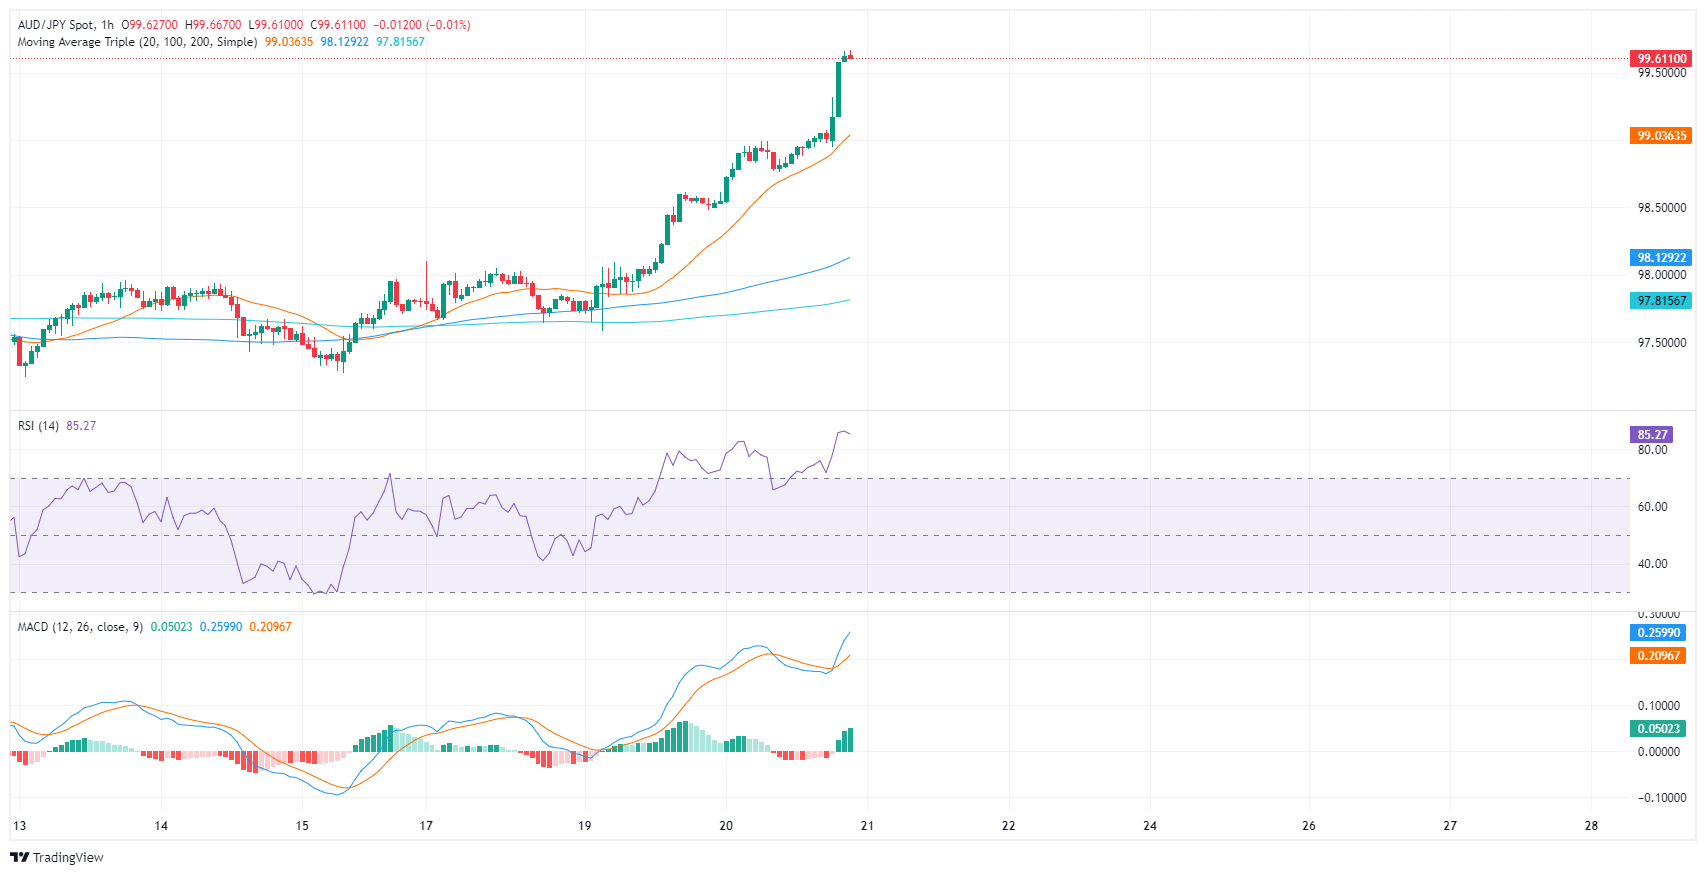
These observations generally point towards bullish conditions for the AUD/JPY pair in the short term but buyers might consider taking profits in the next sessions. On a broader perspective, buyers are also in command as the pair trades above the 20,100 and 200-day Simple Moving Averages (SMAs).


