- The pair met strong resistance at the 20-day SMA, which in case of conquering it, will confirm a bullish bias.
- The daily chart indicators suggest a strengthening upward momentum with the RSI jumping above 50.
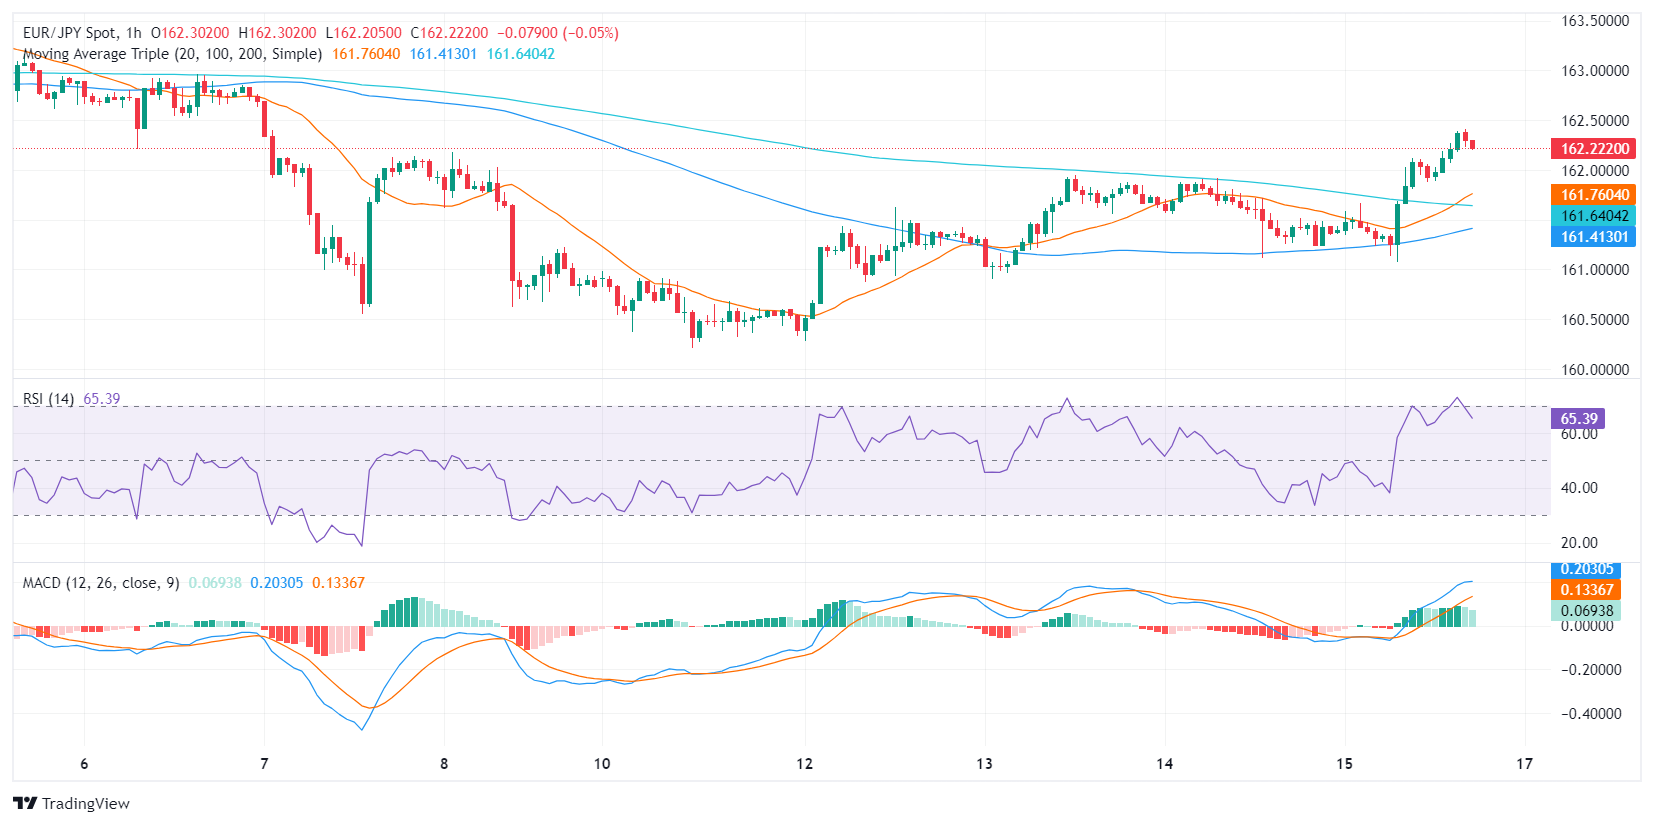
- The hourly RSI hovers in the overbought territory, a potential sign of short-term buyer exhaustion.
In Friday’s session, EUR/JPY trades with gains at 162.27, marking a 0.54% rise in attempting to conquer the 20-day Simple Moving Average (SMA). The bulls seemingly hold a strong grip, as the buying momentum appears to intensify. Yet, the sellers might come into action as the indicators flash overbought signs on the hourly signs.
Based on the indicators of the daily chart for the EUR/JPY pair, the Relative Strength Index (RSI) has moved into positive territory, suggesting a stronger upward momentum. Meanwhile, the downturn of the Moving Average Convergence Divergence (MACD) histogram prints shortening red bars, arguing in favor of a stronger bullish grip.
Turning to the hourly chart, the RSI seems to be hovering in the overbought territory. Despite a strong upward trend, this indicates potential exhaustion from the buyers. Similarly, the MACD’s decreasing green bars might be signaling a shift in the tide, turning favor towards sellers for the short-term period.

Given that the pair remains above the 100- and 200-day SMAs, yet below the 20-day SMA, it gives mixed signals regarding the broader market control. Thus, an interplay of daily and hourly charts suggests an uphill battle with the bulls maintaining control in a larger context, albeit facing potential near-term pressures.
