- Building momentum is indicated by the RSI on the daily chart.
- The hourly chart also strengthens the positive outlook, with the presence of bullish momentum but hinting at a slight wobble.
- The pair recovered the 20-day SMA affirming the continued bullish sentiment.
During Wednesday’s session, the AUD/JPY edged higher. The strength of the buyers primarily on the daily chart fuels this bullish sentiment. However, the hourly chart flashes signs of short-term contention, suggesting a potential consolidation for the rest of the session.
On the daily chart, the AUD/JPY pair indicates some bullish momentum. The Relative Strength Index (RSI) has moved into positive territory, which marks an upbeat momentum, with its latest reading standing slightly above the midpoint. Simultaneously, the Moving Average Convergence Divergence (MACD) histogram printing flat red bars indicates a decreasing bearish momentum in the short term.
Switching to the hourly chart, the RSI is treading in the positive region, confirming the bullish daily scenario. However, the index seems to be consolidating after nearing overbought conditions earlier in the session. In addition, the MACD histogram reveals decreasing green bars, suggesting the bullish momentum is waning on the hourly chart.
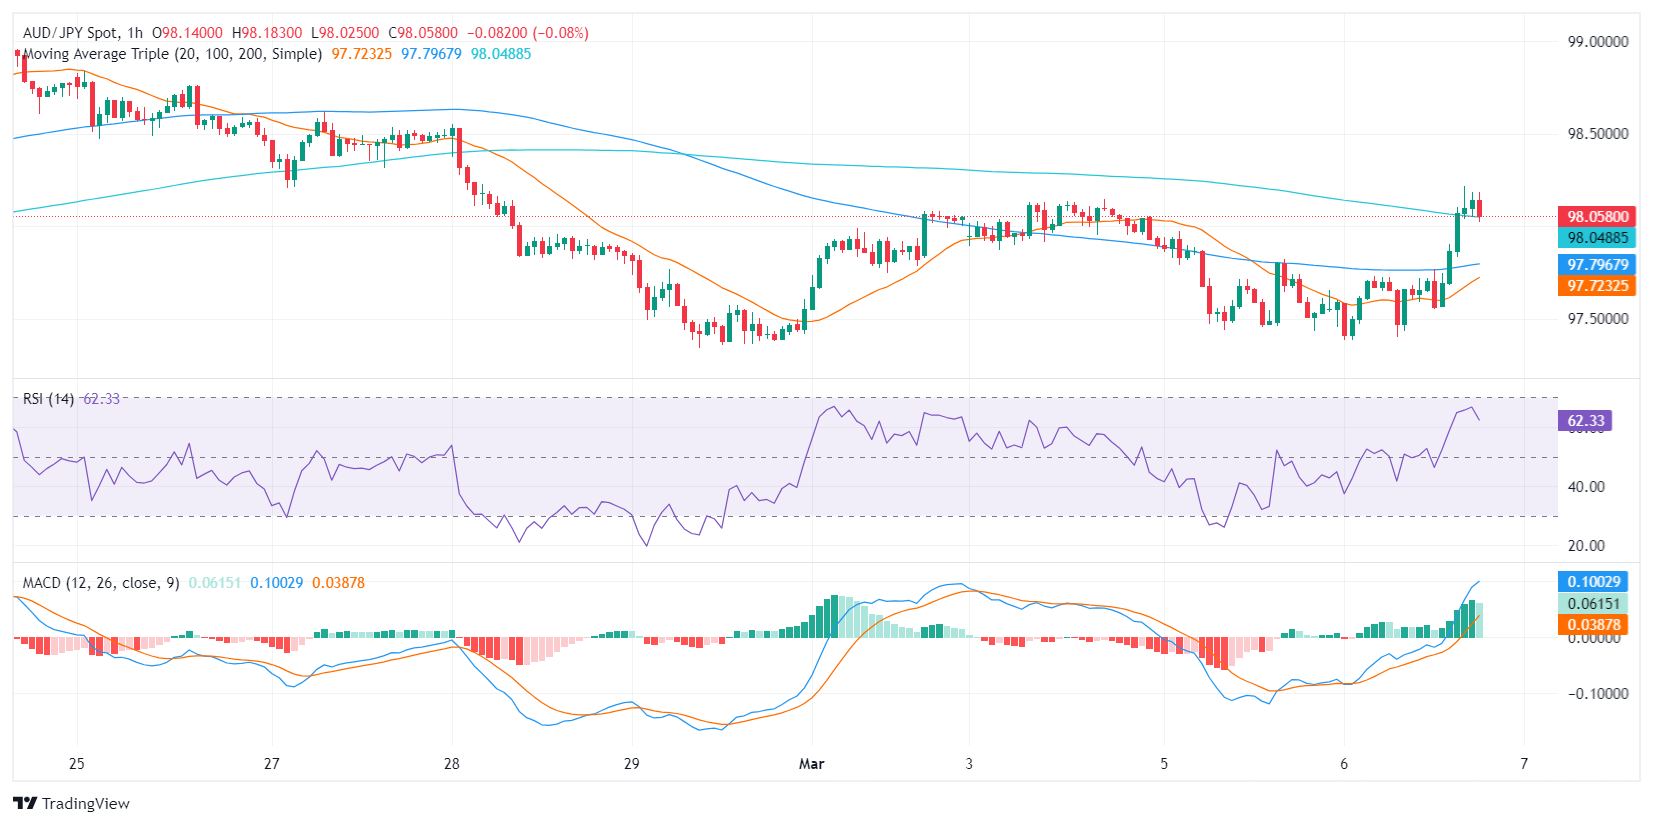
In conclusion, both the daily and hourly charts suggest a bullish momentum, notwithstanding the short-term signs of a pullback. Given the pair’s position being above the 20,100,200-day SMAs, the overall trend remains in favor of the buyers, unless a significant shift in momentum is seen.