- The NZD/JPY settled at 91.12 mild losses in the Friday session.
- The daily RSI reveals a steady bullish momentum.
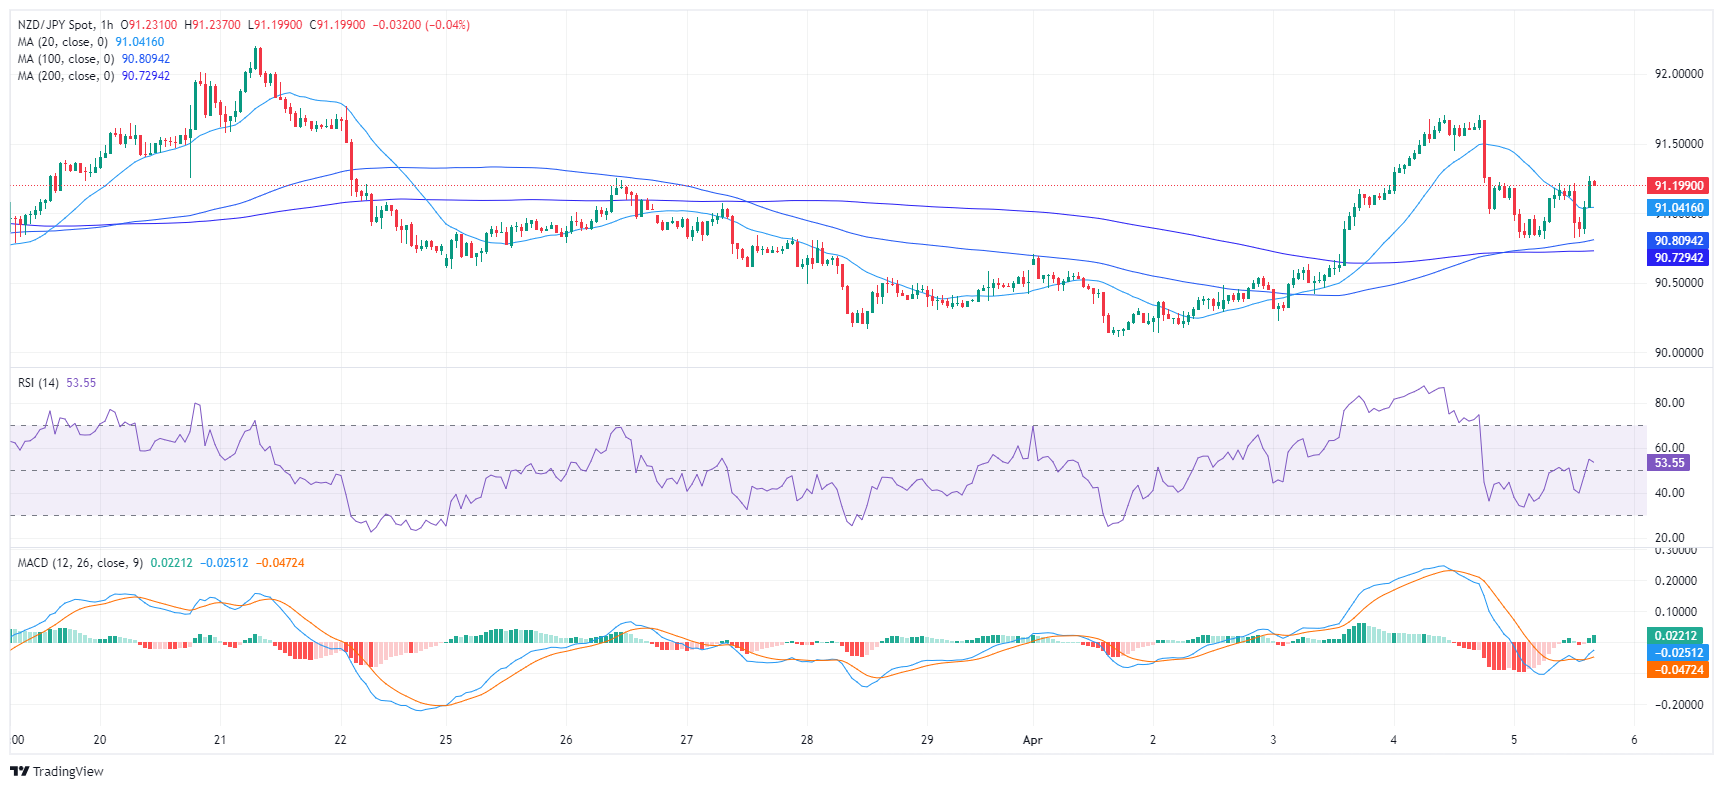
- Hourly chart indicators show a rising bullish sentiment despite some variability.
The NZD/JPY pair, with a slight decline, is currently trading at 91.12 in Friday’s session.On the daily chart, the bullish momentum remains steady while the buyers are more present on the hourly timeframes.
The daily chart reveals that the Relative Strength Index (RSI) for the pair is displaying a broadly favorable trend, with a recent rise from the negative zone into positive territory. Meanwhile, the Moving Average Convergence Divergence (MACD) is producing green bars, indicating positive ascending momentum.
Turning attention to the hourly chart a similar pattern is observed in the RSI values. Despite some variability, in recent hours, the RSI remains in the positive sector, rendering the momentum chiefly bullish. The MACD supports this bullish inclination as it illustrates ascending green bars, implying intensified upward momentum on an hourly timeline.
As for the overall trend, NZD/JPY sits above its 20,100 and 200-day Simple Moving Average (SMA), indicating a bullish stance in the long run.
In summary, as the daily and hourly RSI indicators, in conjunction with the MACD’s green bars, the momentum favors the buyers. However, some flatness was seen in the daily indicators but as long as the pair remains above its main SMAs, the outlook will be positive.