
Bitcoin (BTC) price continues to lead the market north, with Ethereum (ETH) and Ripple (XRP) prices following the intermediate trend. However, as the apex cryptocurrency faces a formidable blockade, the market could correct soon before the next leg up. Low trading volumes characteristic of weekends is one factor to consider, and volatility is likely to increase over the next two days.
Bitcoin, altcoins, stablecoins FAQs
Bitcoin is the largest cryptocurrency by market capitalization, a virtual currency designed to serve as money. This form of payment cannot be controlled by any one person, group, or entity, which eliminates the need for third-party participation during financial transactions.
Altcoins are any cryptocurrency apart from Bitcoin, but some also regard Ethereum as a non-altcoin because it is from these two cryptocurrencies that forking happens. If this is true, then Litecoin is the first altcoin, forked from the Bitcoin protocol and, therefore, an “improved” version of it.
Stablecoins are cryptocurrencies designed to have a stable price, with their value backed by a reserve of the asset it represents. To achieve this, the value of any one stablecoin is pegged to a commodity or financial instrument, such as the US Dollar (USD), with its supply regulated by an algorithm or demand. The main goal of stablecoins is to provide an on/off-ramp for investors willing to trade and invest in cryptocurrencies. Stablecoins also allow investors to store value since cryptocurrencies, in general, are subject to volatility.
Bitcoin dominance is the ratio of Bitcoin’s market capitalization to the total market capitalization of all cryptocurrencies combined. It provides a clear picture of Bitcoin’s interest among investors. A high BTC dominance typically happens before and during a bull run, in which investors resort to investing in relatively stable and high market capitalization cryptocurrency like Bitcoin. A drop in BTC dominance usually means that investors are moving their capital and/or profits to altcoins in a quest for higher returns, which usually triggers an explosion of altcoin rallies.
Bitcoin (BTC) price has made three successive attempts to shatter past the upper boundary of the ascending parallel channel at $53,000. However, the efforts have been futile, likely because of buyer exhaustion as BTC is already overbought, indicated by the Relative Strength Index (RSI) position above 70.
Amid low trading volumes characteristic of weekends, increased volatility could see Bitcoin price drop 5% to the $49,170 support level. In a dire case, the drop could extend to the confluence between the midline of the channel and the upper boundary of the supply zone at $46,760. A break and close below the midline of this order block at $45,554 would confirm the extension of the fall.
BTC/USDT 1-day chart
Conversely, with the bulls still having a strong presence in the BTC market, evidenced by the large volumes of green histogram bars in positive territory, Bitcoin price could shatter the $53,000 barricade. In a highly bullish case, the gains could extrapolate 5% to the $55,000 level.
Also Read: Bitcoin Price Prediction: $55,000 in sight despite overbought state as BTC adversary turns coat
Ethereum (ETH) price is likely to retract, giving sidelined investors another buying opportunity and delaying the $3,000 milestone for a while. The likely target for the drop is the confluence between the horizontal line and the midline of the channel at $2,689, around 7% below current levels.
In a dire case, Ethereum price could pivot around the $2,600 support, levels last tested on Valentine’s Day.
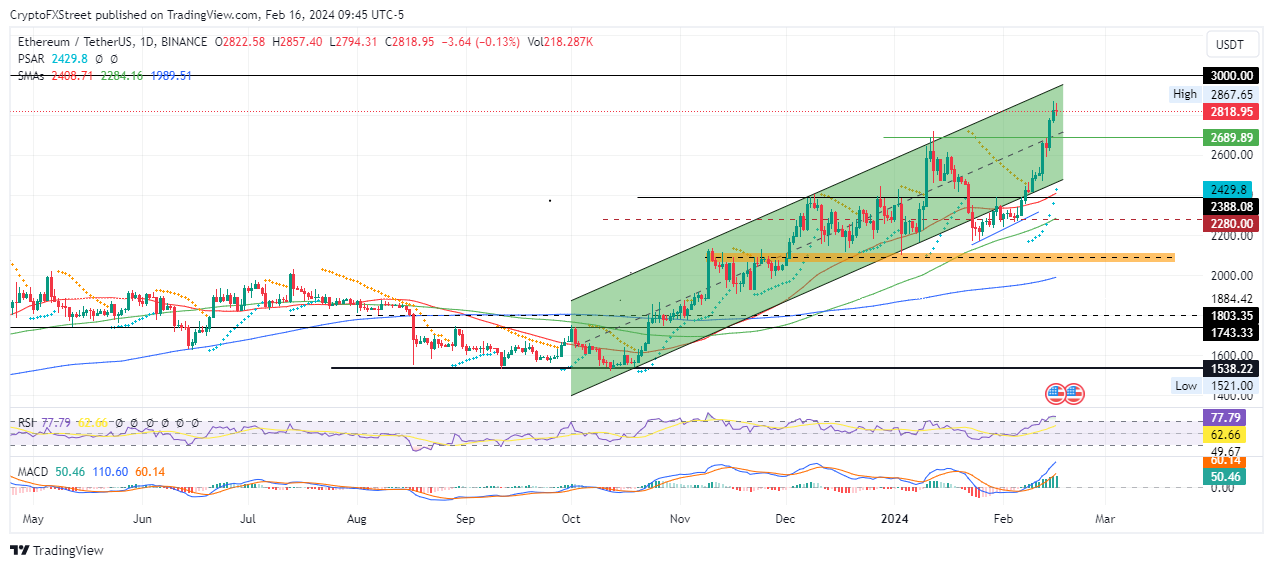
ETH/USDT 1-day chart
On the other hand, with bulls still at play, Ethereum price could extend the gains to clear the range high at $2,867. In a highly bullish case, the Proof-of-Stake (PoS) token could extend a neck north to the $3,000 psychological level, a milestone last tested on April 5.
Also Read: Ethereum follow as BTC shows no signs of stopping
Ripple (XRP) price is suffering the weight of growing overhead pressure due to the 100 and 200-day SMAs at $0.5889 and $0.5671, respectively. Resistance due to the upper boundary of the descending parallel channel has reinforced the pressure.
If XRP bulls show weakness, Ripple price could drop to lose support due to the 50-day SMA at $0.5510. An extended fall could send the payments token to the $0.5368 support, or in a dire case, retest the midline of the channel, which coincides with the Parabolic SAR at $0.5000. Such a move would denote a 10% drop below current levels.
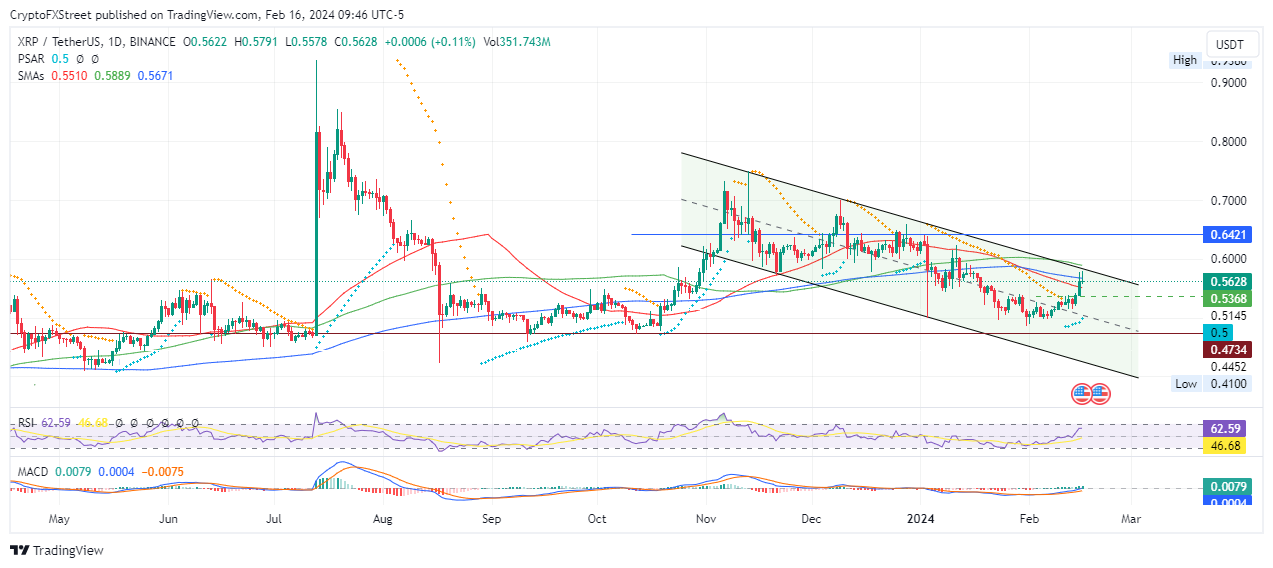
XRP/USDT 1-day chart
Meanwhile, with XRP bulls still maintaining a presence in the market, as seen by the MACD position in positive territory, Ripple price could foray north, shattering the roadblocks to hit the $0.6000 psychological level. In a highly bullish case, the XRP price could extend to the $0.6421 resistance level, last tested on December 28.
Also Read: XRP price could climb to $1 target if Ripple scores another win in SEC lawsuit


