
- Bitcoin price flashed a weekly sell signal after producing a bearish swing failure pattern.
- BTC might attempt to overcome the previous ATH at $69,138 before a potential correction ensues.
- The weekly imbalance, extending from $59,111 to $53,120, is a key range where buyers might step in.
- As ETF inflows slow down, the outflow data will now have a noticeable impact on the market’s sentiment.
Bitcoin’s (BTC) upward momentum has shown a significant decline for the past two weeks or so. This development led to a bearish signal on the weekly and an uncertain outlook on the monthly. As a result, BTC might not be clear of potential sell-offs.
Read more: Why is the crypto market crashing?
Bitcoin bearish SFP interpretations
Bitcoin’s weekly chart showed a bearish Swing Failure Pattern (SFP) confirmed on March 17. This technical indicator occurs in an uptrend when the price attempts to break above a significant resistance level but fails to sustain momentum. This development leads to a reversal in the price direction, often signaling a potential shift in the market sentiment from bullish to bearish.
In Bitcoin’s case, the push above the previous all-time high (ATH) of $69,138 failed to sustain the bullish momentum enough to produce a weekly close above it. As a result, the candlestick closed below it, creating the bearish SFP.
Implications of BTC’s sell signal
- Profit-taking and Bull Exhaustion: The SFP could signify profit-taking by early investors after a failed ATH sweep. This profit-taking could lead to a temporary pullback into a trading range before the uptrend resumes
- Bearish Reversal: In a more bearish scenario, the SFP could be the beginning of a trend reversal. The preceding strength might have been a bull trap, luring buyers before a significant decline. This outlook was noticed on the monthly chart in October 2021, where the price created a bearish SFP, leading to the bear market that knocked BTC down by 77%.
As described in a previous publication, the bearish SFP does not indicate a reversal, considering the current market conditions. Instead, the sell signal could be a sign of exhaustion of momentum. Hence, investors should expect a potential pullback into the weekly imbalance, ranging from $59,111 to $53,120.
Despite the weekly chart showing signs of recovery and a potential bounce, the monthly chart has yet to do the same. The monthly imbalance, extending from $59,111 to $49,027, is also a range to watch for. BTC should ideally close above $56,975. A failure to do so could result in a correction to the $54,069 support level.
BTC/USDT 1-week, 1-month chart
BTC ETF flows have a lagging impact
As noted in a previous article, the ETF flow data also plays a pivotal role in influencing the market. The decline in ETF inflows that began after $1.04 billion on March 13 has continued, and as of March 20, an outflow of—$261 million was noted, making it the third consecutive outflow.
Hence, if the outflows continue to dominate, Bitcoin price is likely to correct to the aforementioned levels.
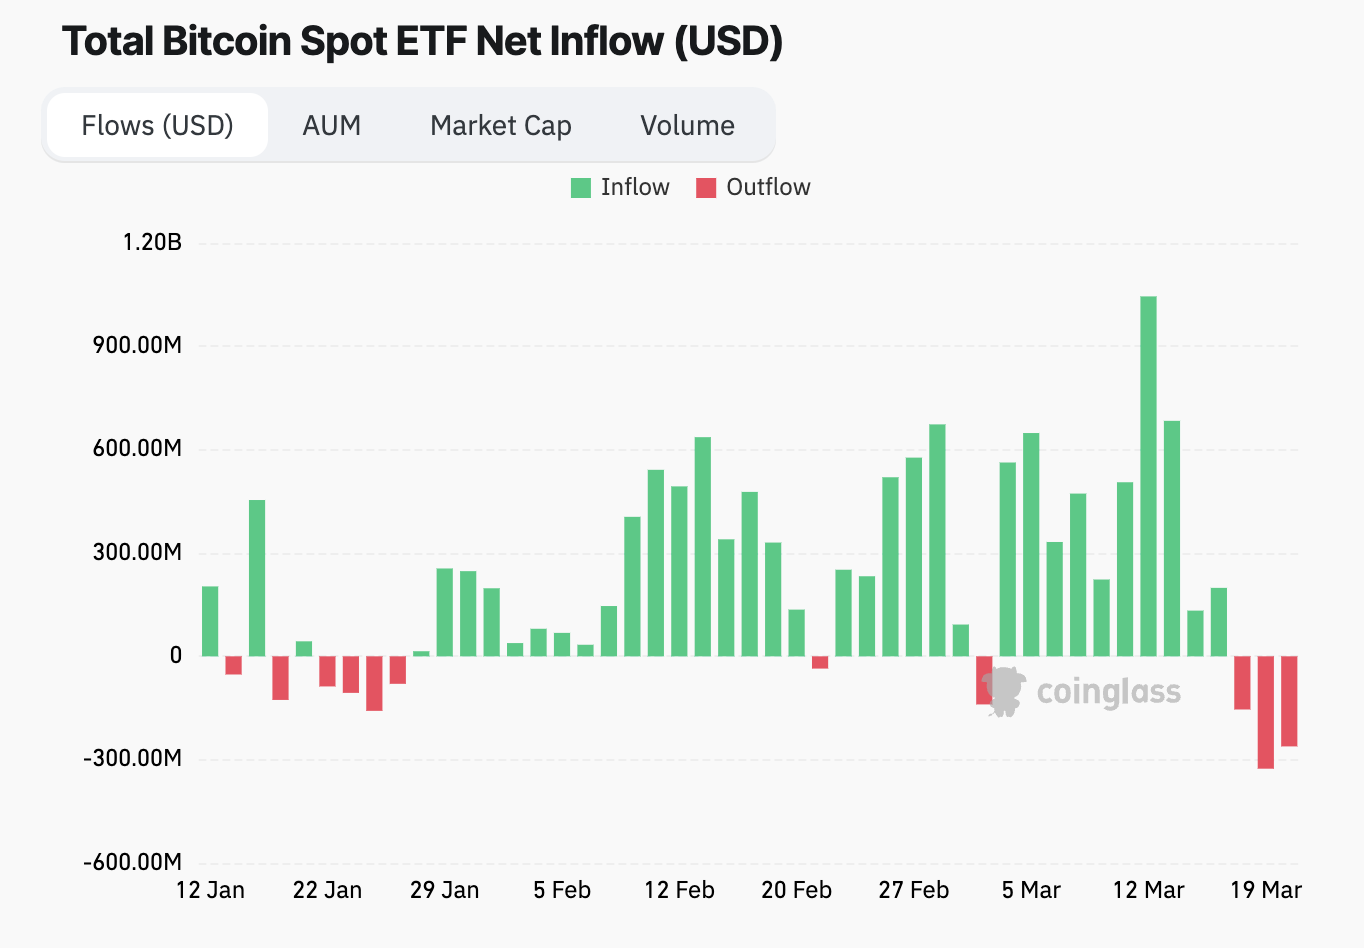
BTC ETF flows
While the data indicates the bullish trend is still intact on a higher time frame, a weekly close below $53,120 will invalidate this thesis by signaling a shift in sentiment favoring bears. This development would invite a potential correction to the $45,156 key level.
Read more: Bitcoin price could hit a new ATH, but there’s a caveat to this bounce


