

- Bitcoin price could make a move on the $43,750 barrier.
- Ethereum price risks a 5% drop as technical indicators for ETH show weakness.
- Ripple price could fall 7% to October lows as XRP consolidates within a bearish technical formation.
Bitcoin (BTC) price is showing strength again amid waning selling pressure from Grayscale Bitcoin Trust (GBTC) redemptions. The sentiment is yet to be reflected among altcoins, however, as Ethereum (ETH) and Ripple (XRP) prices still struggle amid a choppy altcoin market.
Also Read: Bitcoin Weekly Forecast: BTC price remains indecisive despite strong fundamentals
Bitcoin (BTC) price is trading with a bullish bias, consolidating along an ascending trendline for the past week. It had fallen below critical support just a few weeks ago, slipping beneath the ascending bottom trendline in the aftermath of GBTC redemptions.
The king of cryptocurrency has found strength as GBTC outflows shrink. Specifically, GBTC selling pressure is almost over, moving from $1.8 billion to less than $200 million per day now.
GBTC outflows
Besides reducing outflows, the sales are being absorbed easily, with Bitfinex whales scooping up the $39,000 bottom in Bitcoin price as they bought over 7,000 BTC of spot. The absorption is also seen with growing limit bids on Coinbase.
Bitcoin price could restore above the $43,750 support, flipping the major ascending trendline into support.
In a highly bullish case, Bitcoin price could extend to $48,000, or a neck higher to $50,000, 15% above current levels.
The Relative Strength Index (RSI) is above the 50 midline, while the Moving Average Convergence Divergence (MACD) indicator is moving above its signal line (orange band). The position of the MACD and the Awesome Oscillator (AO) in positive territory tilts the odds further in favor of the upside.

BTC/USDT 1-day chart
On the flipside, if traders book profits for the ground covered so far, Bitcoin price could drop, losing support due the minor ascending trendline. This could see BTC test the $40,726 support, or confirm the downtrend by breaching below the midline of the demand zone at $39,196.
Also Read: Bitcoin price recovers as on-chain metrics point at potential BTC rally
Ethereum (ETH) price, like Bitcoin, is trading along a minor ascending trendline. However, for its case, the technical indicators are bearish, with the RSI below 50 and the MACD and AO in negative territory.
With the odds favoring the downside, Ethereum price could fall 5% to the $2,200 level, or in a dire case, into the demand zone between $2,059 and $2,118.
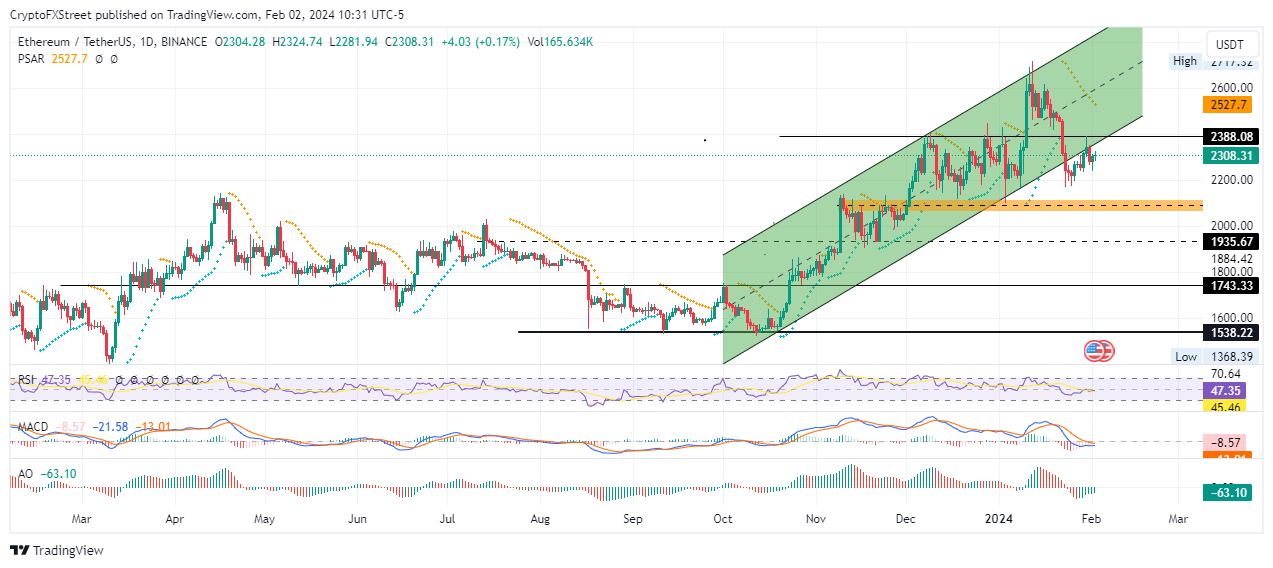
ETH/USDT 1-day chart
Conversely, a reentry by the bulls could see Bitcoin price foray back into the ascending channel by flipping the $2,388 blockade into support. This could set the path for a move north, with ETH reclaiming the range high of $2,717 in a highly bullish case.
Also Read: Ethereum monthly transaction count climbs to highest level since July 2022
Ripple (XRP) price could fall 7% to the $0.4734 support with growing overhead pressure due to the confluence between the 50-day and 200-day SMAs at $0.5778 and $0.5817, respectively, as well as the 100-day SMA at $0.6009.
The RSI is also sub-50, below its signal line (yellow band) with the AO and MACD in negative territory. With the price stuck below the midline of the channel, the downside potential is gaining strength.

XRP/USDT 1-day chart
Conversely, traders buying the dip could send Ripple price north, but the bearish thesis would only be invalidated if XRP records a decisive daily candlestick close above $0.6421. This would set the tone for an extension to the $0.7000 psychological level, 40% above current levels.
Also Read: XRP price slumps despite Ripple’s FOMO Pay announcing link between Asia and Africa