- Indicators flash oversold conditions on the daily chart.
- Contrarily, hourly chart indicators suggest a slow return of bullish impulse as the bears might have run out of steam.
In Friday’s session, the NZD/USD declined just below the 0.6000 threshold, illustrating a bearish outlook as sellers continue to dominate the market. The pair is positioned below its primary Simple Moving Averages (SMAs), further backing the bearish perspective. Technical indicators hint at a strengthening sellers’ command but indicators lay in oversold terrain, a typical signal, and the buying momentum might recover.
On the daily chart, the Relative Strength Index (RSI) for the NZD/USD pair resides in negative territory presently, indicating a prevailing downtrend as sellers dominate the market. The RSI was reported at 33, bordering on oversold conditions, a potential indication for future corrective movement. The Moving Average Convergence Divergence (MACD) histogram exhibits rising red bars, also confirming the negative momentum.
Moving to the hourly chart, the RSI levels convey a relatively similar scenario. The value last rested at 28, corroborating its presence in the oversold territory. Contrarily, the MACD on the hourly chart displays rising green bars, hinting at a creeping positive momentum.
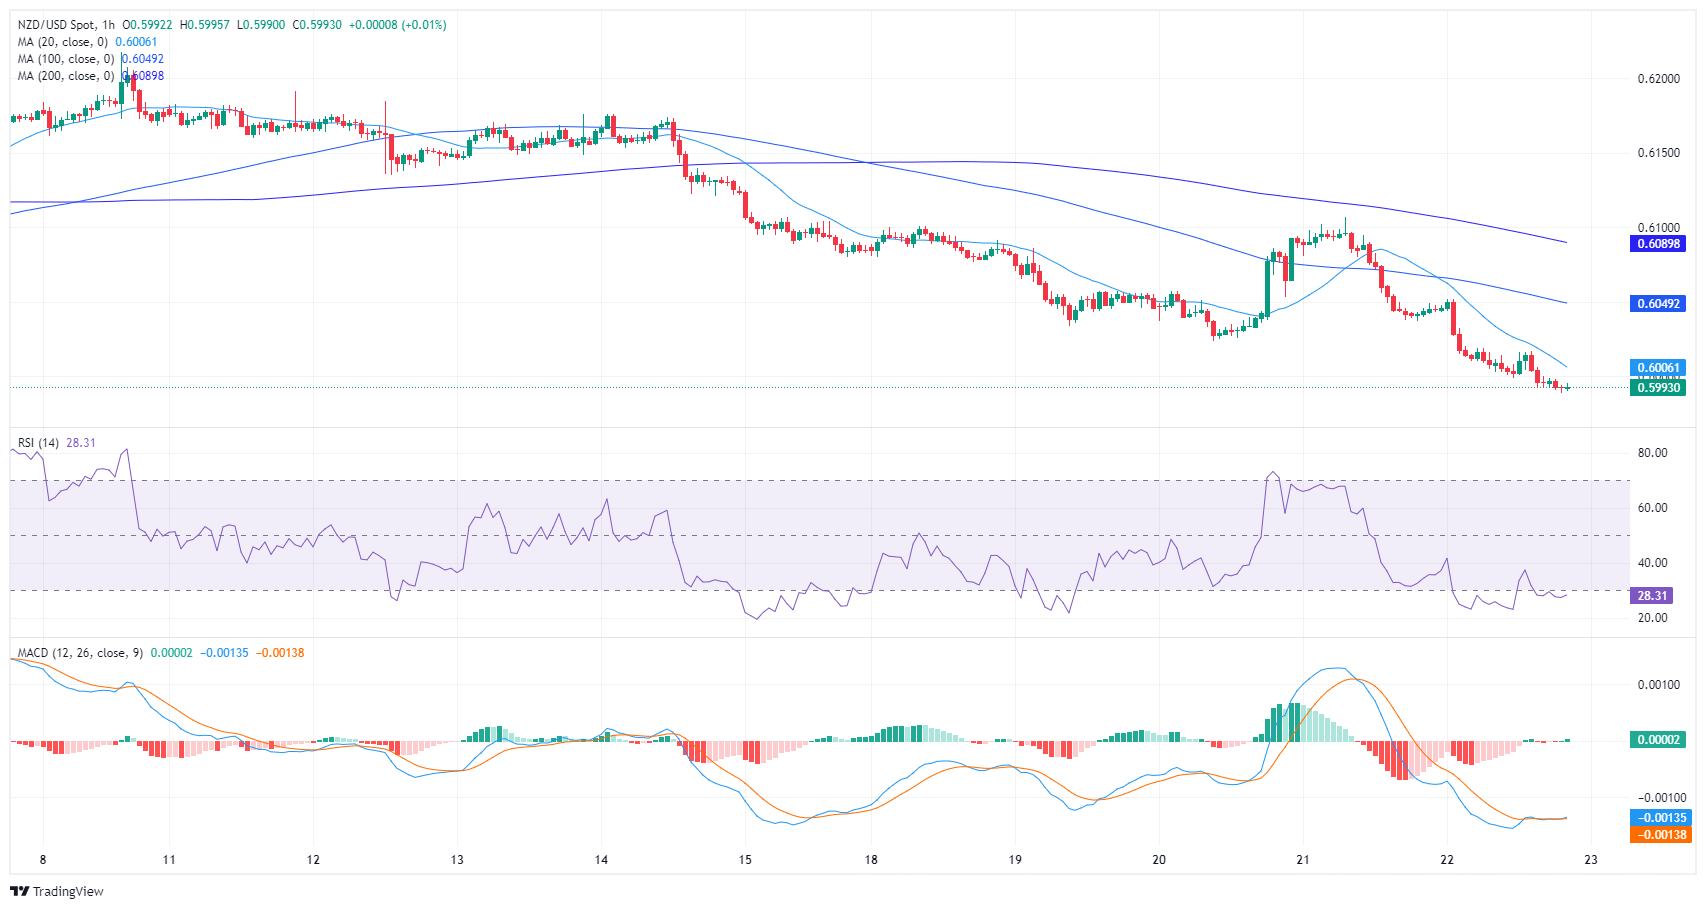
In essence, while the daily chart discloses a persisting bearish momentum, hourly indications of rising positive momentum in the MACD histogram may signal a reprieve from selling pressure. Looking at the broader trend, the pair is below the 20, 100, and 200-day Simple Moving Averages (SMAs), further implying a bearish outlook.