
- Bearish pressure intensified on the daily chart, and the pair lost the 20-day SMA.
- As the pair lies deeply oversold on the hourly chart, buyers might start taking profits.
The NZD/JPY pair is trading at 90.748, marking a significant dip of 0.98%. Despite the presence of strong selling pressure, the pair persistently resides above its 100 and 200-day Simple Moving Averages (SMAs). This suggests a dominant bullish force in long-term time frames. But the fact the sellers conquered the 20-day average, paints the short-term outlook with a negative tone.
Based on the indicators of the daily chart, some important dynamics can be observed. The Relative Strength Index (RSI), currently at 43, resides in the negative territory. This position, coupled with its falling, suggests a dominance of sellers in the market for now. In addition, the Moving Average Convergence Divergence (MACD) histogram reveals rising red bars, further substantiating the negative momentum.
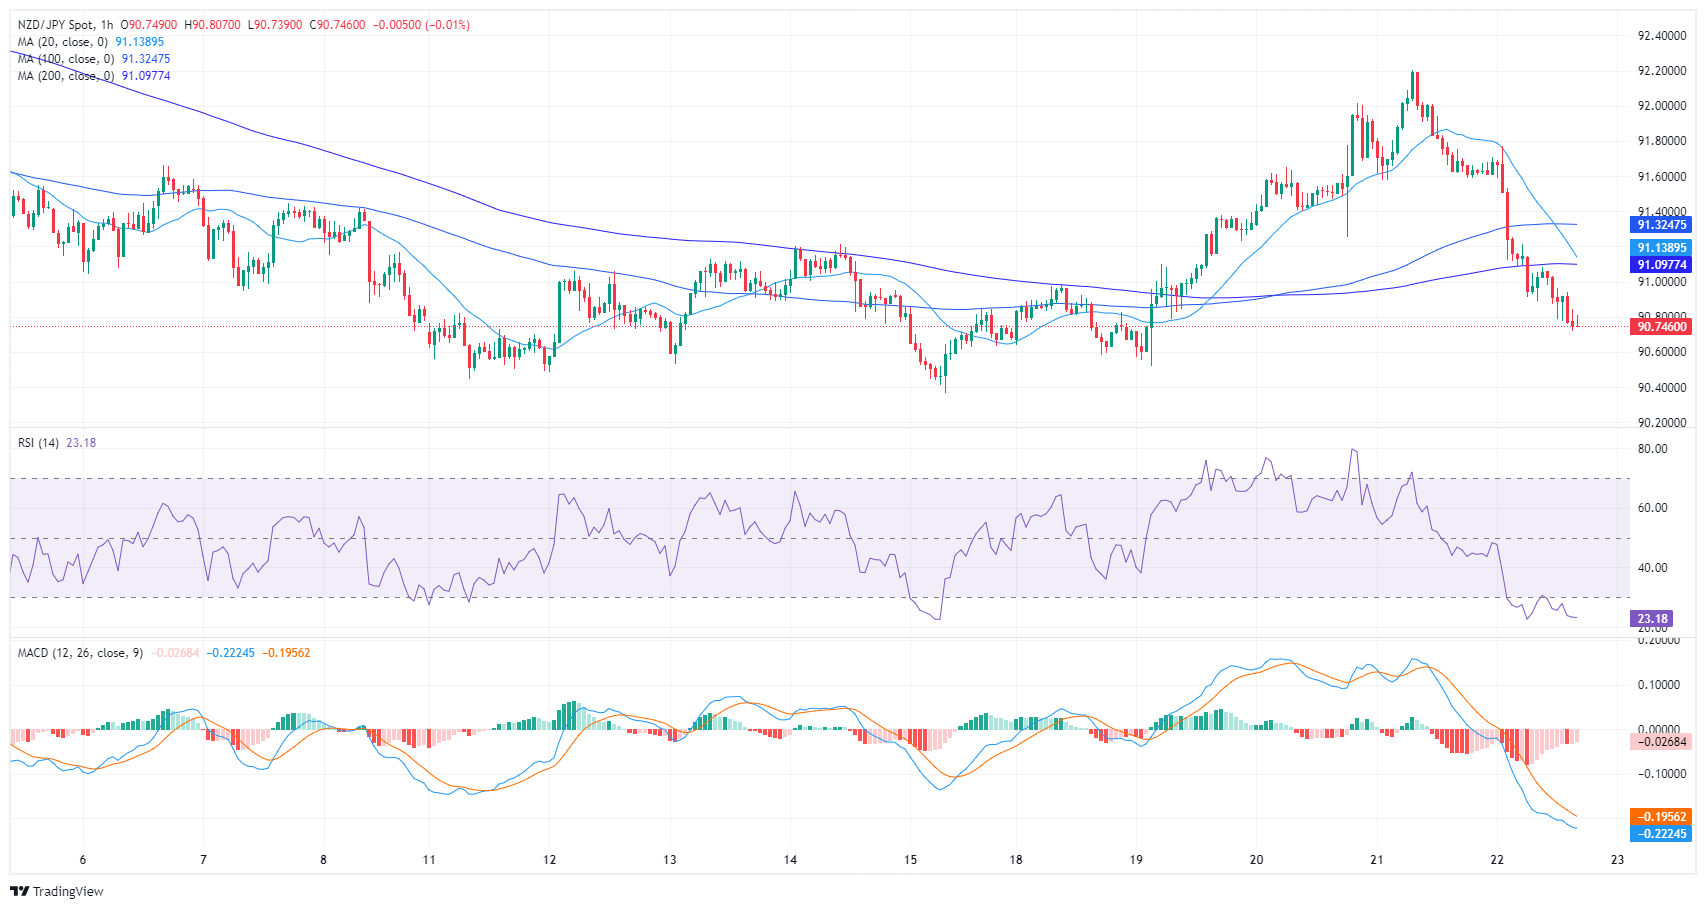
Shifting to the hourly chart, the RSI shows a value of 23, indicating that the pair is deeply oversold. Compared to the daily chart, an amplified negative trend is apparent. However, the MACD on this shorter time frame similarly showcases flat red bars, emphasizing the current bearish momentum but a less intense grip which might suggest that the pair might start consolidating.
If the bulls want to maintain the overall bullish trend, they must defend the 100 and 200-day SMAs. In case lost, the bearish pressure might intensify further. In the meantime, they could act as a support for sellers to consolidate their downward movements.


