

- The daily chart reveals a mostly bearish environment with somewhat flat indicators.
- The hourly chart analysis depicts a potential bearish shift with the RSI reading close to the neutral-negative zone.
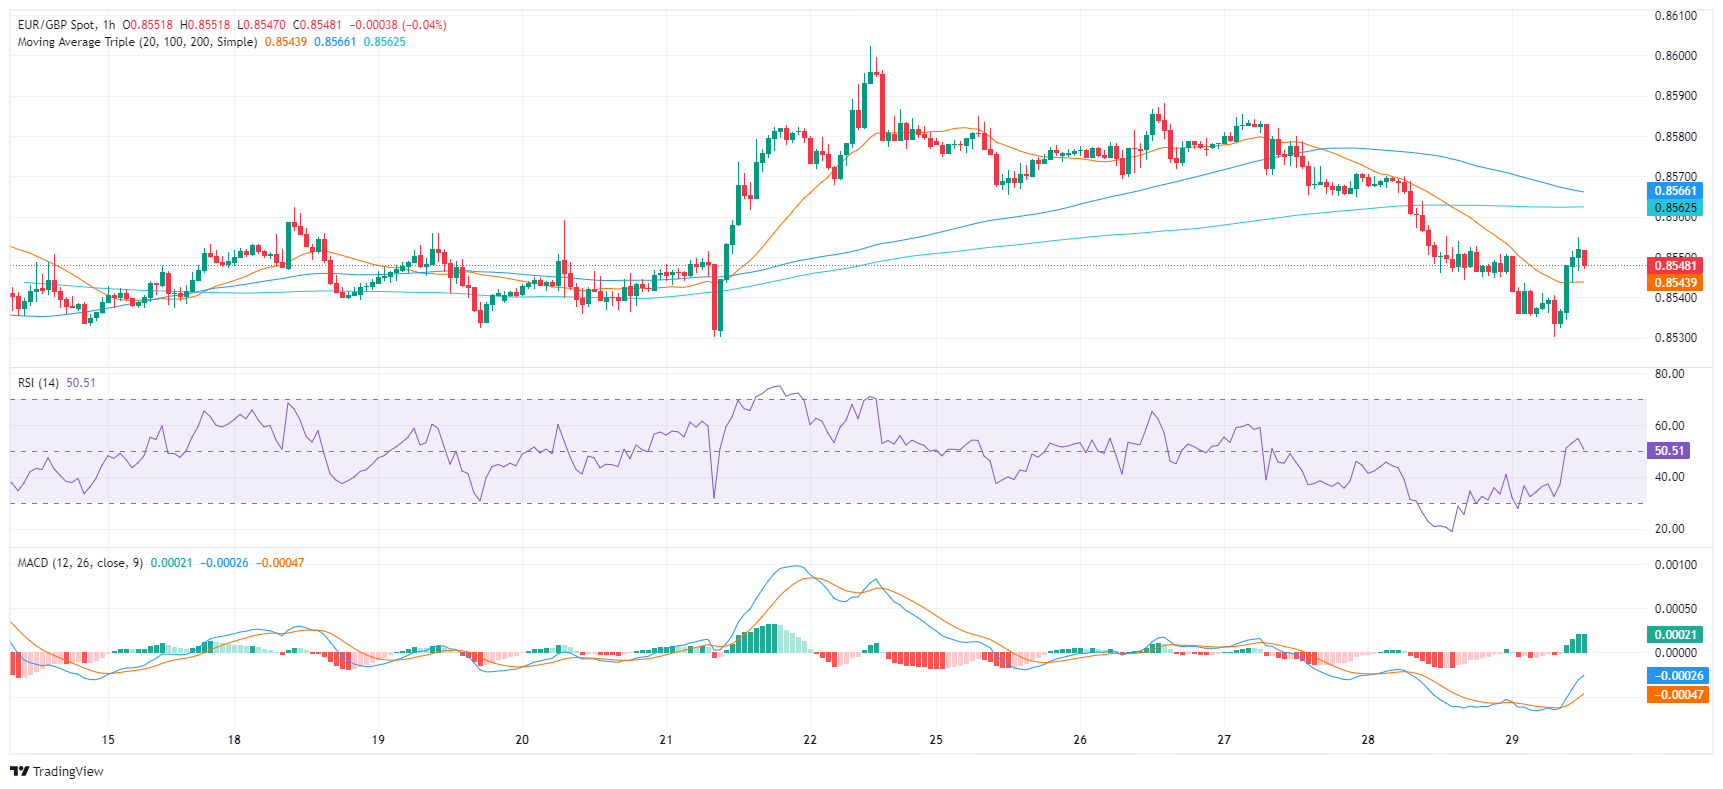
The EUR/GBP pair is currently trading at 0.8550, with minor losses on Friday’s session. The sellers are exerting their presence as bullish momentum remains weak and the fact that the cross remains below its main Simple Moving Averages (SMAs) of 20,100 and 200-days contributes to the bearish bias.
On the daily chart, the Relative Strength Index (RSI) currently resides in negative territory but stands flat while the Moving Average Convergence Divergence (MACD) prints neutral green bars, suggesting stagnant momentum. This demonstrates the trend might continue in the near term.
Moving to the hourly chart, the RSI shows a mixed trend with readings ranging from 33 and then recovering to 50 standing on the edge of the neutral-negative territory. Coupled with flat green bars on the MACD histogram, there might be a shift towards a bearish momentum after the bulls’ short recovery during the European session.
In conclusion, both the daily and hourly analyses point to a primarily negative trend for EUR/GBP, albeit with potential hourly fluctuations. If the buyers want to avoid losses they should reclaim the 200-day SMA around 0.8550 and build support around it.