![COST daily chart Elliott Wave technical analysis [Video]](https://biedexmarkets.com/wp-content/uploads/2024/01/Chevron-CVX-flat-correction-remains-in-progress.jpg)
Unlocking ASX Trading Success: RMD – RESMED INC Stock Analysis & Elliott Wave Technical Forecast.
ASX: RMD – RESMED INC (1D Chart) Elliott Elliott Wave Technical Analysis TradingLounge (1D Chart).
Greetings, Our Elliott Wave analysis todaya updates the Australian Stock Exchange (ASX) with RMD – RESMES INC shares. We have identified a Expanded Flat correction pattern, indicating the potential for RMD to continue declining further.
ASX: RMD – RESMED INC (1D Chart) Elliott Elliott Wave Technical Analysis.
ASX: RMD – RESMED Inc 1D chart (Semilog scale) analysis
Function: Major trend (Minor degree, red).
Mode: Motive.
Structure: Impulse.
Position: Wave ((c))-green of Wave 2-red.
Details: The short-term outlook indicates that wave 1-red has completed, and wave 2-red is unfolding as an Expanded Flat to push lower before wave 3-red resumes upward momentum. The downward movement seeks support around 26.66, and this bearish perspective will be maintained as long as the price remains below 30.90.
Invalidation point: 21.14.
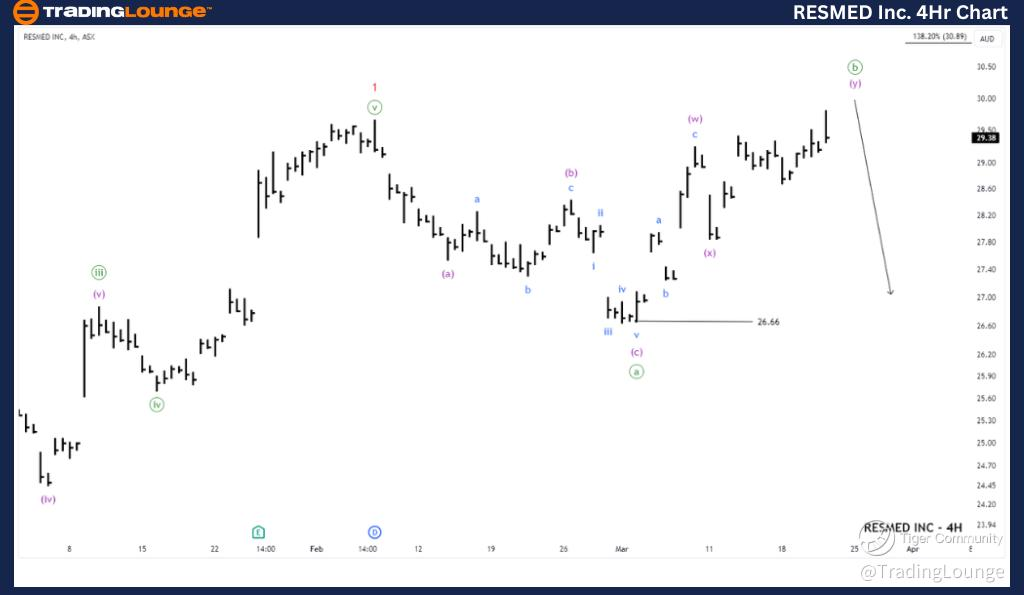
ASX: RMD – RESMED INC (1D Chart) Elliott Elliott Wave Technical Analysis TradingLounge (4-Hour Chart).
ASX: RMD – RESMED INC Elliott Wave Technical Analysis.
ASX: RMD – RESMED INC four-hour chart analysis
Function: Counter trend (Minute degree, green).
Mode: Corrective.
Structure: Expanded Flat.
Position: Wave (y)-purple of Wave ((b))-green.
Details: The shorter-term outlook suggests that wave 2-red is unfolding as an Expanded Flat, where wave ((b))-green resembles a corrective wave and seems to be nearing completion. Wave ((c))-green may decline further, seeking support around 26.66. As long as the price remains below 30.89, this bearish perspective remains confident.
Invalidation point: Don’t know yet.
Conclusion:
Our analysis, forecast of contextual trends, and short-term outlook for ASX: RMD – RESMED INC aim to provide readers with insights into the current market trends and how to capitalize on them effectively. We offer specific price points that act as validation or invalidation signals for our wave count, enhancing the confidence in our perspective. By combining these factors, we strive to offer readers the most objective and professional perspective on market trends.
Technical Analyst: Hua (Shane) Cuong, CEWA-M (Master’s Designation).

