As our members know Meta Stock has been giving us good trading opportunities recently. In this technical article we’re going to take a quick look at another Elliott Wave trading setup of META published in members area of the website. As our members know, META is showing bullish impulsive sequences in the cycle from the 313.66 low. Our team recommended members to avoid selling , while keep favoring the long side. Recently we got a pull back that reached our buying zone. The stock found buyers and made reaction from the blue box as expected. In the further text we are going to explain the Elliott Wave Forecast and trading strategy.
META stock Elliott Wave one hour chart 01.25.2024
We believe the stock is giving us wave (iv) intraday pullback. Correction looks incomplete at the moment. The price structure shows lower low sequences from the peak, suggesting more downside toward marked blue box zone: 387.8-383.9. At that zone buyers should ideally appear for further rally or 3 waves bounce at least. We don’t recommend selling Meta stock against the main bullish trend. Strategy is buying the dips at the marked extreme zone: 387.8-383.9.
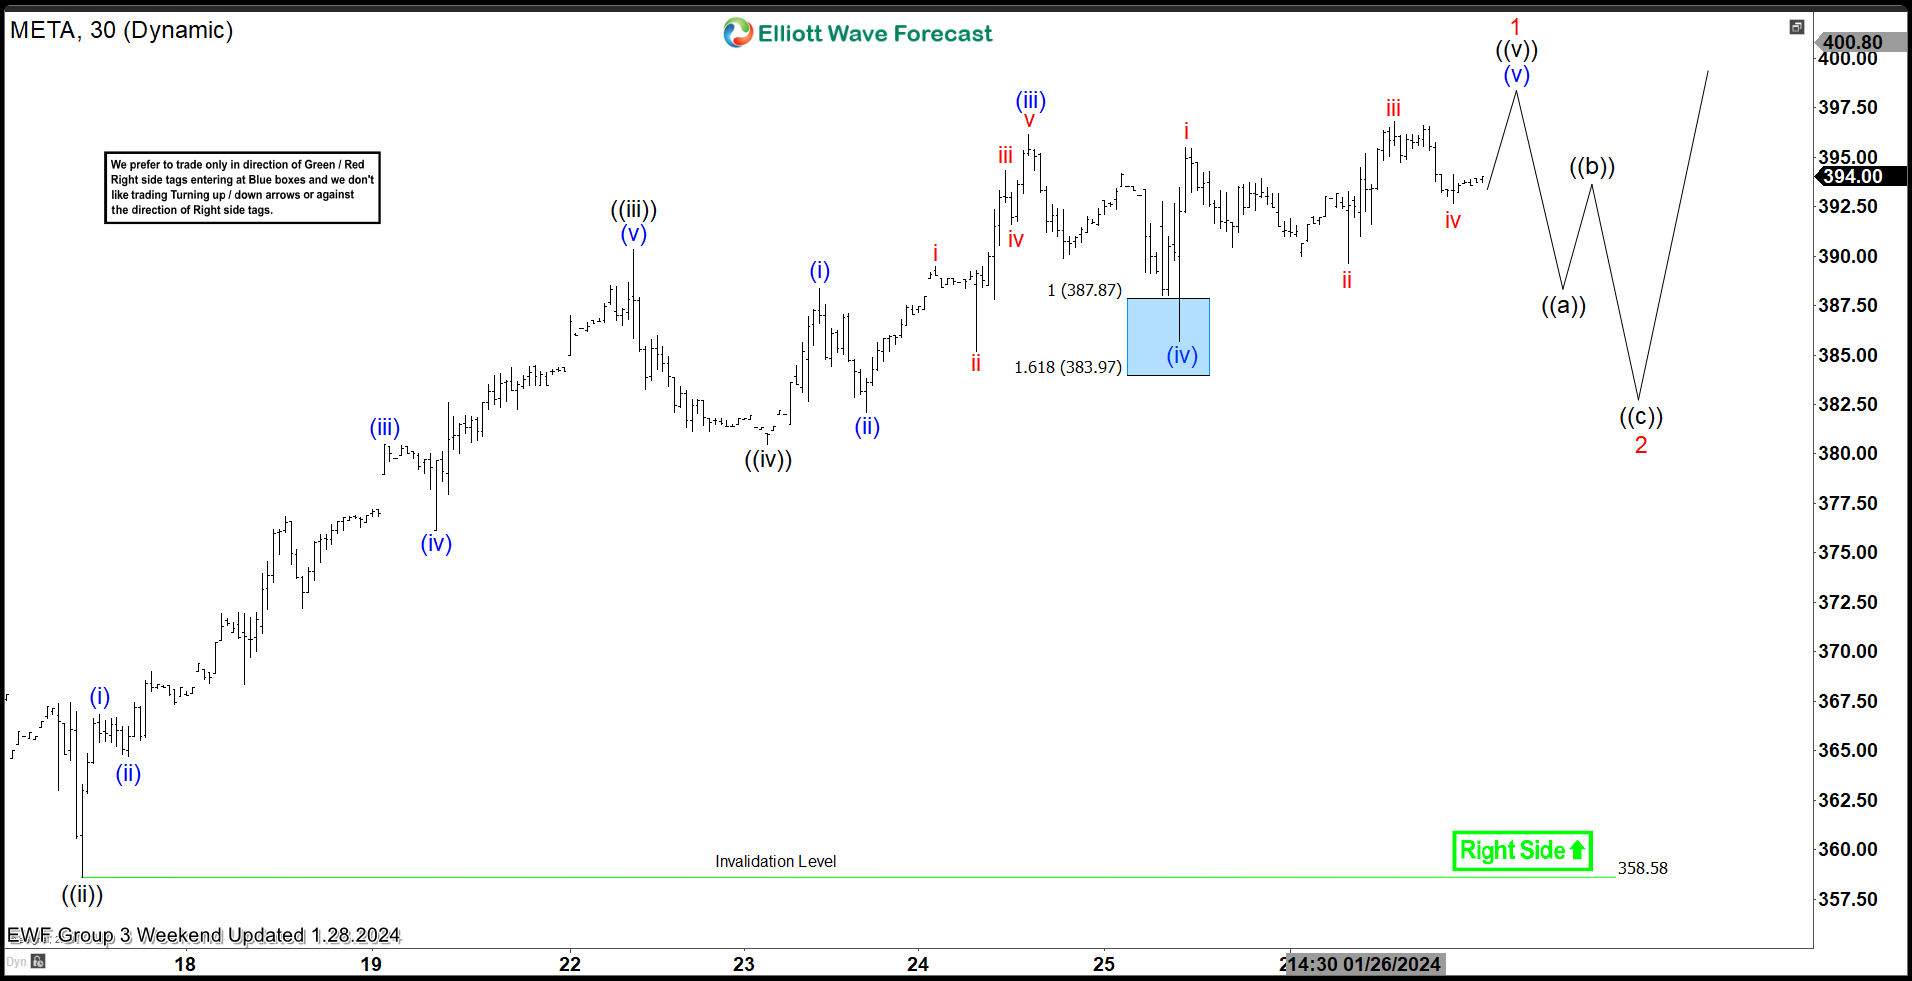
META stock Elliott wave one hour chart 01.28.2024
META found buyers at the blue box as we expected. The stock made very good reaction higher from our buying zone. Pull back completed right at the Blue Box area at the 386.07 low. Any long positions from the equal legs area should be risk free by now. We count wave (iv) blue pull back completed at the 386.07 low. Shot term rally from that low, looks incomplete at the moment. As of right now we can count only 3 waves up, looking for another high to complete wave (v) blue ideally.