
- Bitcoin price’s horizontal consolidation is likely exhausted as the king of cryptocurrency leans south.
- BTC could make a 10% drop to the 61.8% Fibonacci level at $47,445 as bears gain ground.
- The bearish thesis will be invalidated if the price records a new local top above the $52,985 range high.
Bitcoin (BTC) price has extended a leg south after trading within a range for days. While the move has harmed multiple traders, particularly the ones who had taken short positions, it is the first sign that the next directional bias may be finally ready to show.
Also Read: Bitcoin price consolidation could precipitate a fall as US markets remember President Washington
Cryptocurrency prices FAQs
Token launches like Arbitrum’s ARB airdrop and Optimism OP influence demand and adoption among market participants. Listings on crypto exchanges deepen the liquidity for an asset and add new participants to an asset’s network. This is typically bullish for a digital asset.
A hack is an event in which an attacker captures a large volume of the asset from a DeFi bridge or hot wallet of an exchange or any other crypto platform via exploits, bugs or other methods. The exploiter then transfers these tokens out of the exchange platforms to ultimately sell or swap the assets for other cryptocurrencies or stablecoins. Such events often involve an en masse panic triggering a sell-off in the affected assets.
Macroeconomic events like the US Federal Reserve’s decision on interest rates influence risk assets like Bitcoin, mainly through the direct impact they have on the US Dollar. An increase in interest rate typically negatively influences Bitcoin and altcoin prices, and vice versa. If the US Dollar index declines, risk assets and associated leverage for trading gets cheaper, in turn driving crypto prices higher.
Halvings are typically considered bullish events as they slash the block reward in half for miners, constricting the supply of the asset. At consistent demand if the supply reduces, the asset’s price climbs. This has been observed in Bitcoin and Litecoin.
$160 million long positions liquidated as Bitcoin slips 2%
Bitcoin (BTC) price slipped almost 1.30% on Tuesday, liquidating $158.79 million in long positions against $52.37 million in short positions.
BTC liquidations chart
Liquidations in the cryptocurrency space occur when traders’ positions are forcibly closed as a consequence of their margin accounts no longer being able to support their open positions. It follows a drop in the asset’s price or shortage in sufficient margin to meet the maintenance requirements.
With a combined liquidation of over $210 million, relative to Monday’s $142 million, the surge in liquidations points to enhanced trading activity as well as volatility within the crypto arena.
Nevertheless, Bitcoin price has been in a lull for the past few days, consolidating on the back of unstable inflows into spot Bitcoin exchange-traded funds (ETFs).
Bitcoin price outlook as BTC longs go underwater
Bitcoin price has leaned south, with the Relative Strength Index (RSI) suggesting the fall could only be beginning as BTC is overbought. If this momentum indicator slips below the 70 level, it would signify that BTC is ripe for selling, instigating a sell-off.
The Awesome Oscillator (AO) is also showing a large red histogram bar, suggesting that the bears are establishing a presence in the BTC market.
The ensuing seller momentum could send Bitcoin price south, with a forecasted 10% fall to test the supply zone turned bullish breaker between $45,556 and $46,691. A break and close below the midline of this order block at $46,166 would confirm the continuation of the downtrend.
Nevertheless, if this order block holds as support, Bitcoin price could pivot for a bounce that would see BTC market value provide a buying opportunity before the next leg north.
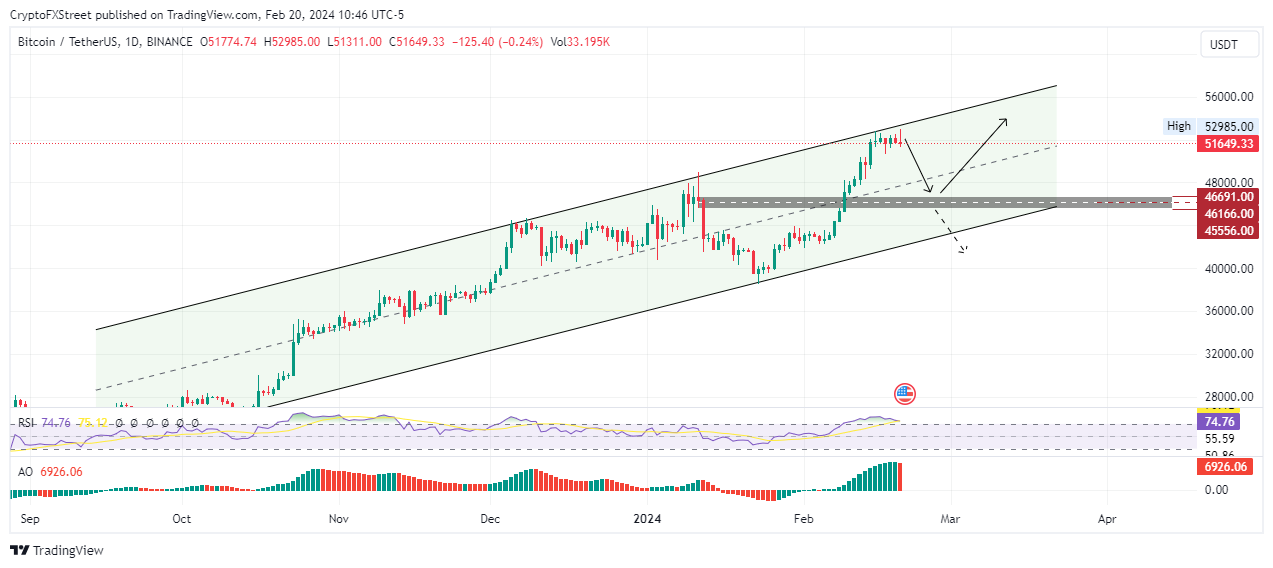
BTC/USDT 1-day chart
On the other hand, if BTC bulls increase their buying pressure at current levels, Bitcoin price could push north, shattering past the upper boundary of the ascending parallel channel.
Such a directional bias would bring the $55,000 milestone into focus, or in a highly bullish case, set the pace for BTC market value to hit $60,000, levels last tested on November 21, 2021. This would constitute a 16% climb above current levels.


